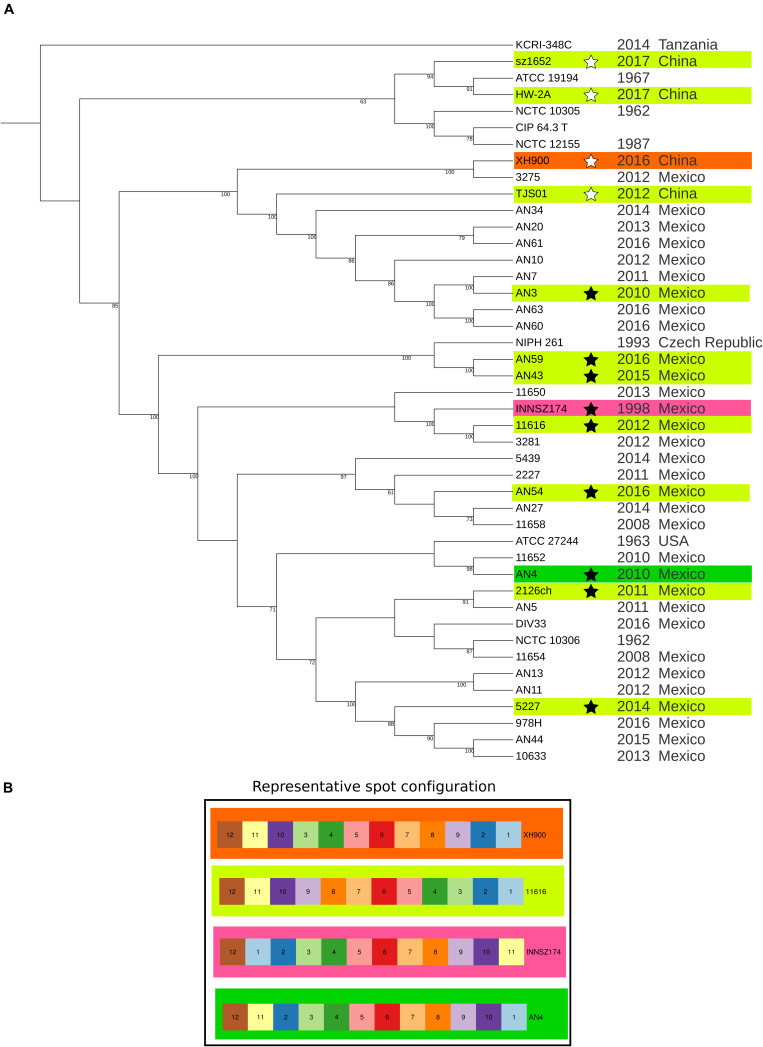
FIGURE 1.
Maximum likelihood phylogeny of core protein-coding genes and spot configuration in representative genomes. (A) Maximum likelihood phylogeny. The ML tree was built with the 955 core monocopy orthologous protein-coding genes without recombination signals between the 44 analyzed A. haemolyticus genomes. The tree was drawn with iTOL. Annotation includes isolation year and isolation country. Stars mark representative genomes. Branch length is not to scale. Bootstrap values above 60% are shown. (B) Graphic representation of spot configuration of representative genomes. The background color is used to clarify where the spot configuration is located in the representative genomes in the phylogeny.

