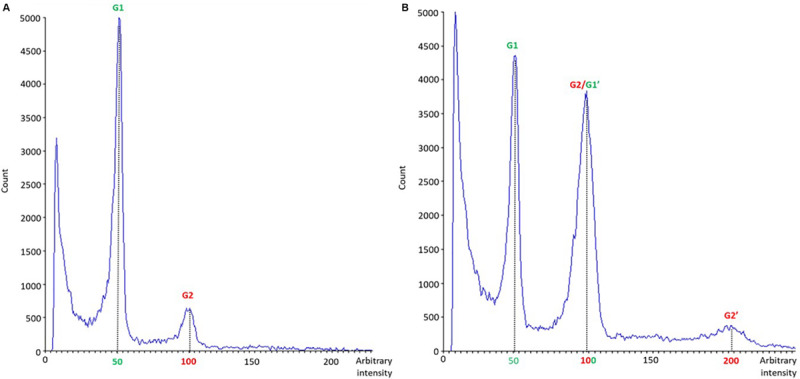
FIGURE 8.

Nuclear DNA histogram patterns of diploid (A) and mixoploid (B) in vitro regenerated plants of C. sativa analyzed by flow cytometry. The x-axis represents a fluorescence intensity level proportional to the nuclear DNA content. The peak located at the value 50 corresponds to the diploid nuclei in phase G1, the peak located at the value 100 corresponds to the sum of the diploid nuclei in phase G2 and the tetraploid nuclei in phase G1, while the one at the value 200 represents tetraploid nuclei in G2 phase. The y-axis indicates the number of nuclei analyzed.
