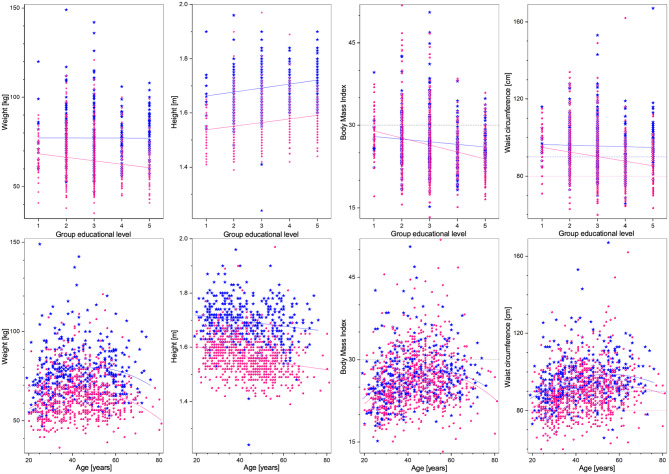
Figure 1.
Anthropometric measures (from left to right: weight, height, BMI, and WC) as a function of educational level (top), and age (bottom). Distribution blue stars correspond to men, pink dots to women, continuous lines correspond to the best minimum least squares adjustment of the data, and dashed lines to cutoff values.

