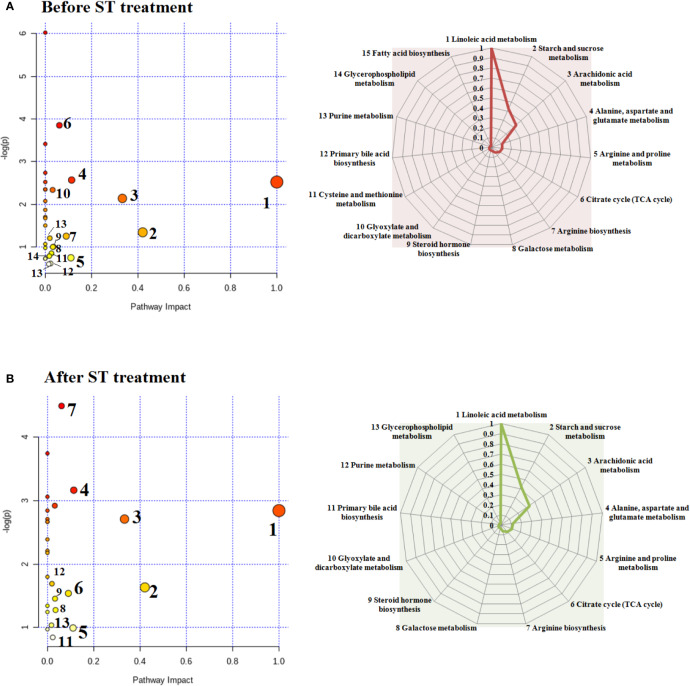
Figure 7.
Changes in endogenous metabolic pathways before and after ST treatment and the corresponding influence values in the spider web. Before ST treatment, fifteen metabolic pathways with p value more than zero in animals model (A). After ST treatment, thirteen metabolic pathways with p value more than zero in animals model (B).

