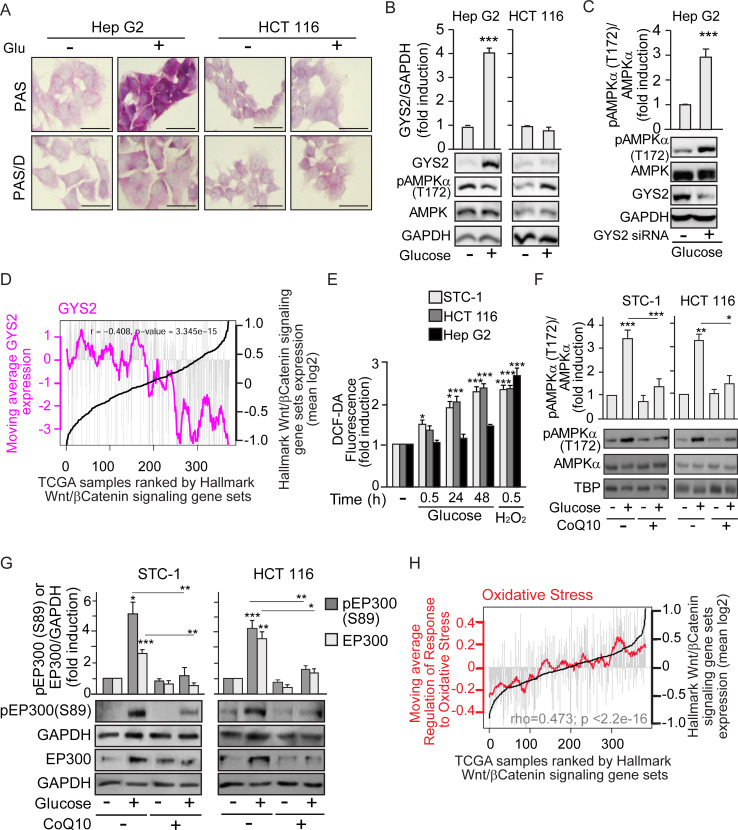
Fig 4. Cell-type–specific glucose induction of AMPK depends on the fate of glucose: To be stored as glycogen or metabolized to increase ROS.
See related results in S4 Fig. Cells were cultured as earlier; starvation of glucose lasted 24 h for cells that required pre-treatment with CoQ10 (10 μM) or transfection. Before starvation, pre-treatment with CoQ10 was 12 h and transfection for 48 h. (A) Glycogen stores in Hep G2 and HCT 116 colon cancer cells, revealed by PAS staining. Diastase treatment (PAS-D) degrades glycogen and reveals specificity of staining; scale bars: 25 μm. (B) Differential induction of the rate-limiting enzyme for glycogen synthesis GYS2 in Hep G2 and HCT 116. Representative western blots and statistical analysis with GAPDH as loading control. (C) Induction of pAMPK (T172) by glucose in Hep G2 cells upon depletion of GYS2 by transfection with GYS2-specific siRNA (+) or the SC (−). (D) Bioinformatic analysis of the TCGA human liver cancer (HCC) cohort. Individual samples were ranked by expression of the GSEA “HALLMARK β-catenin signaling” gene set (black line). Grey bars indicate levels of expression in each individual tumor sample of GYS2. Pink line represents the moving average GYS2 across each 20 liver cancer samples. P value and correlation coefficient (rho) are indicated. (E) ROS production in gastrointestinal STC-1 and HCT 116 and in hepatoblastoma Hep G2 cancer cells, measured by flow cytometry using DCF-DA 0.5 μM as a label in response to glucose 25 mM or H2O2 100 μM as positive control. (F) and (G) Western blotting analysis as in (B) with GAPDH or TBP as loading controls. (F) Effect of CoQ10 blockade of ROS on induction of pAMPK (T172) by glucose. (G) Effect of CoQ10 on induction of pEP300 (S89) by glucose. (H) Bioinformatic analysis of TCGA human colon cancer cohort, gene expression data. Individuals are ranked by the GSEA “HALLMARK β-catenin signaling” gene set (black line). Grey bars indicate levels of expression in each individual tumor sample of the GSEA “Regulation of the response to oxidative stress” gene set. Red line represents the moving average of the oxidative stress signature across each 20 colorectal cancer samples. P value and correlation coefficient (rho) are indicated. Statistical analysis by Student t test (B–C) or one-way ANOVA (E–G) of n ≥ 3 independent experiments. Values represent mean ± SEM; *P < 0.05; **P < 0.01; ***P < 0.001. Underlying data can be found as S1 Data and raw images at S1 Raw Images. AMPK, AMP-activated protein kinase; CoQ10, Coenzyme Q10; DCF-DA, 2’7’-dichlorodihydrofluorescein diacetate; GAPDH, Glyceraldehyde 3-phosphate dehydrogenase; GSEA, gene set enrichment analysis; GYS2, Glycogen Synthase 2; PAS, Periodic Acid-Schiff; PAS-D, Periodic Acid-Schiff with alpha amylase; ROS, reactive oxygen species; SC, scramble control; TBP, TATA-box-Binding Protein; TCGA, The Cancer Genome Atlas.

