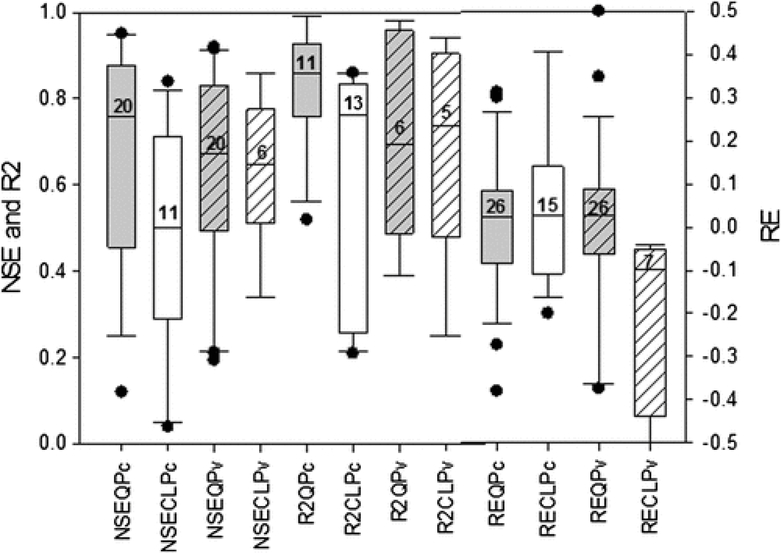
Fig. 3.
Summary of NSE, R2, and RE GOF statistics obtained from the literature review (all data taken from Tables 1 and 2). QP, gray boxes; CLP, white boxes; lowercase “c” and solid boxes, GOF statistics reported for the calibration period; lowercase “v” and hashed boxes, values reported for a validation period; numbers above the median line of each box in the diagram are the sample size

