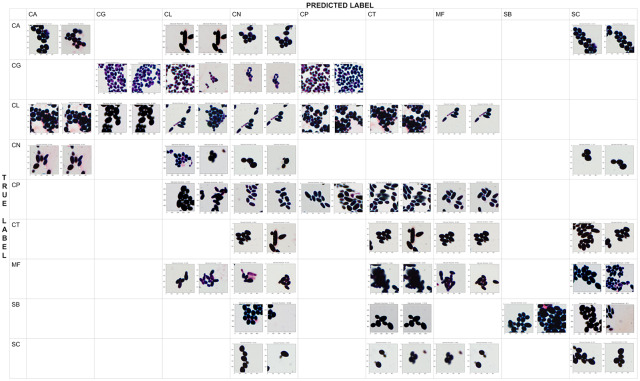
Fig 6. The qualitative confusion matrix for deep Fisher Vector (with AlexNet and SVM).
Each cell contains at most two patches of a “true” strain (represented by rows) that were classified as “predicted” strain (given by columns). Notice that the patches highly overlap, and they are often misclassified due to the artifacts in the background (such as purple trail).

