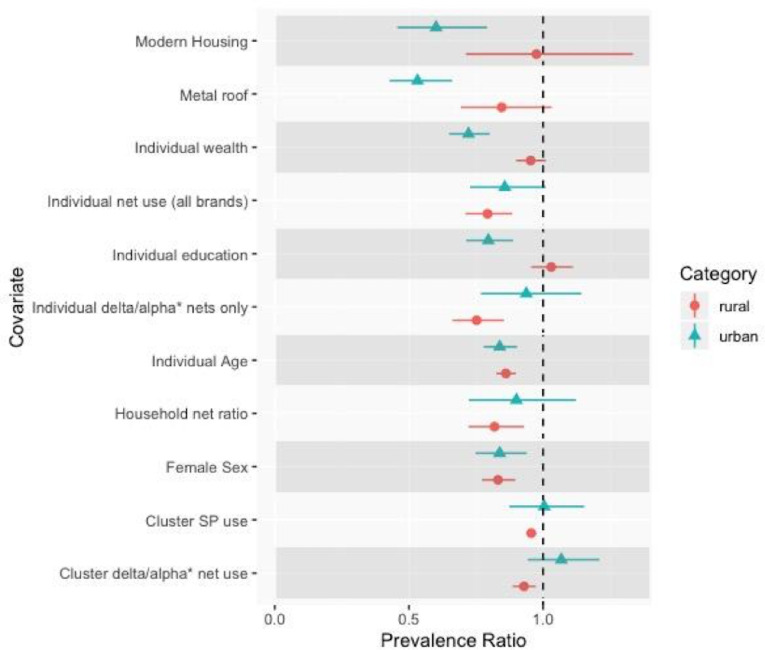
Figure 4.
Results of the analysis comparing risk factor effects between urban versus rural areas. Prevalence ratios and confidence intervals by urban status are presented for each risk factor. Urban results are presented with blue triangles, rural results with red circles. Differences in point estimates indicate differences of the prevalence ratio by urbanicity. The associations of several factors, such as modern housing, education, and wealth, demonstrated differences between urban and rural areas. The null value (Prevalence Ratio = 1) is indicated with a vertical dashed line.

