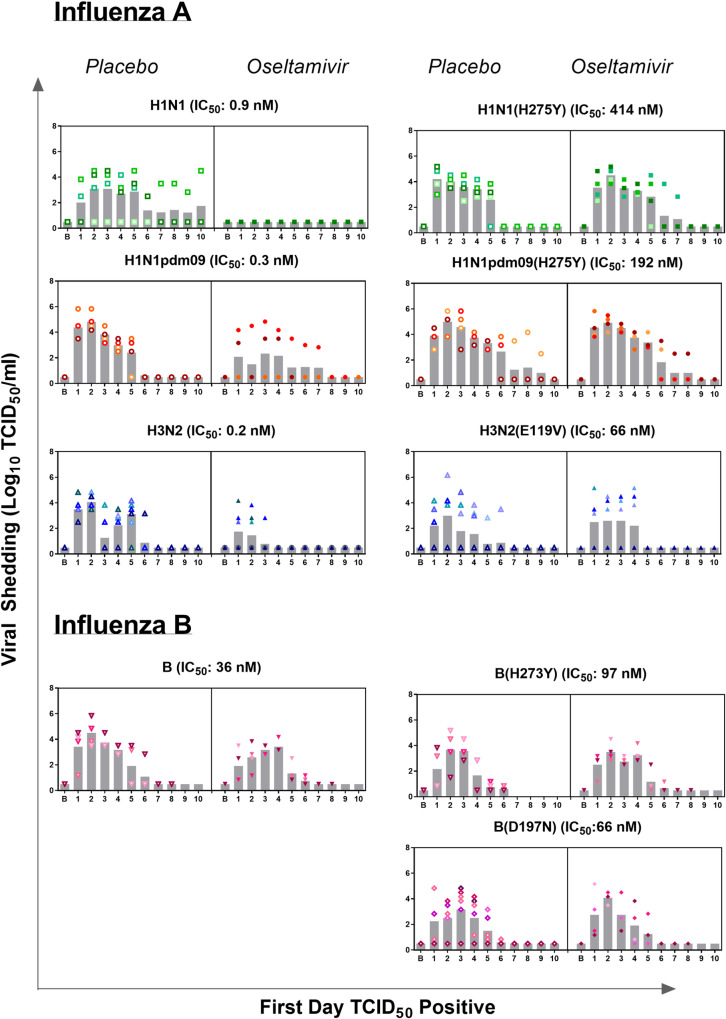
Fig 1. Viral shedding data from ferrets exposed to different viruses and dosed with either OST or Placebo.
The data for all ferrets are shown after standardising to first day of TCID50 positive, as this day varied between different ferrets, and each individual ferret within a group is identified by a separate colour. The variability in first day of viral shedding is summarised in S2 Fig. The bar graphs represent the mean viral titre for all ferrets within the group on each day. The B stands for baseline.

