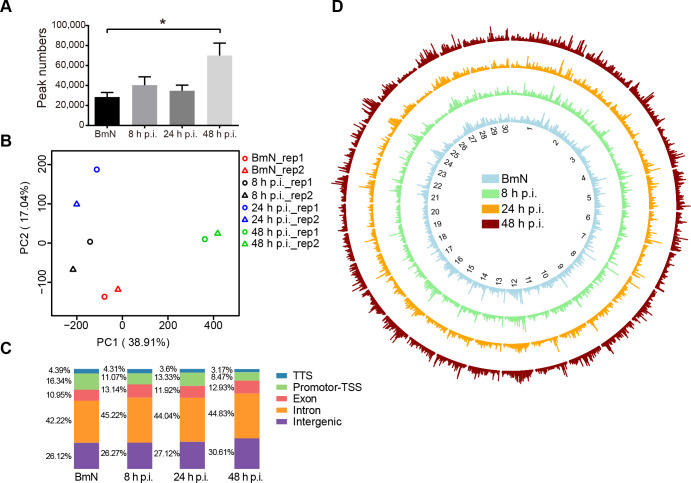
Fig 2. Landscape of DNA accessibility in BmN cells and BmNPV-infected cells.
(A) The accessible peak numbers of each sample. Student’s t-test was performed between BmN samples and 48 h p.i. samples. (B) PCA of peak accessibility in all samples. Each symbol represents an independent biological replicate. PC1 (38.91%) and PC2 (17.04%). (C) Distribution of genomic features of all accessible regions. Five annotations were examined, transcription terminal site (TTS), promoter-transcription start site (TSS), exon, intron, and intergenic. (D) Circle diagram depicting the chromatin accessibility of the 30 longest scaffolds.

