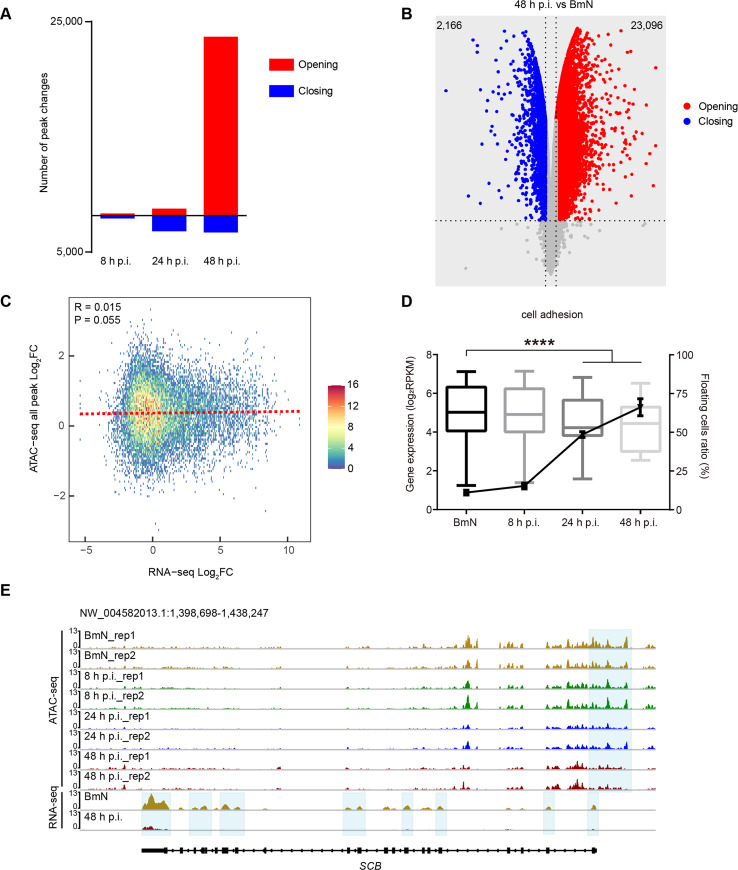
Fig 3. Differentially accessible peaks analysis.
(A) The number of differentially accessible peaks at 8, 24, and 48 h.p.i. (B) Volcano plot of differentially accessible peaks between BmN cells and the 48 h p.i. group. (C) Correlation of chromatin accessibility at all peak and gene expression between BmN cells and the 48 h p.i. group. (D) Boxplot of the expression levels of cell adhesion associated genes and the proportion of floating cells during viral infection. Two-way ANOVA was performed to analyze the significance of gene expression levels between BmN cells, and the 24 and 48 h p.i. groups. Student’s t-test was performed for floating cell data between BmN cells, and 24 and 48 h p.i. samples. (E) Normalized ATAC-seq and RNA-seq profiles at SCB loci. Shaded regions are representative of a decline by 48 h p.i.

