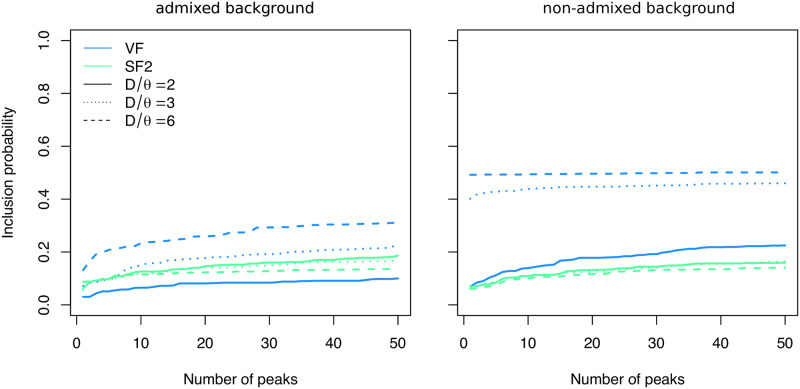
Fig 6. Detection probability with Out-of-Africa human demography.
Probability of an introgression sweep event to be detected in a genome-scan analysis using VolcanoFinder (blue) or SweepFinder2 (green). The x-axis represents the number of false-positive peaks from the neutral data that score higher than the true-positive signal. The donor species diverged from the recipient species 615 kya (solid lines) 1.230 mya (dotted), or 2.460 mya (dashed), corresponding to D/θ = 2, 3, 6, respectively. Selection on the adaptive allele is strong (2Ns = 1000). The left panel shows results with an admixed genomic background while the right panel shows results with the non-admixed background. Sample size n = 40 chromosomes and test sites were placed each 250 bp.

