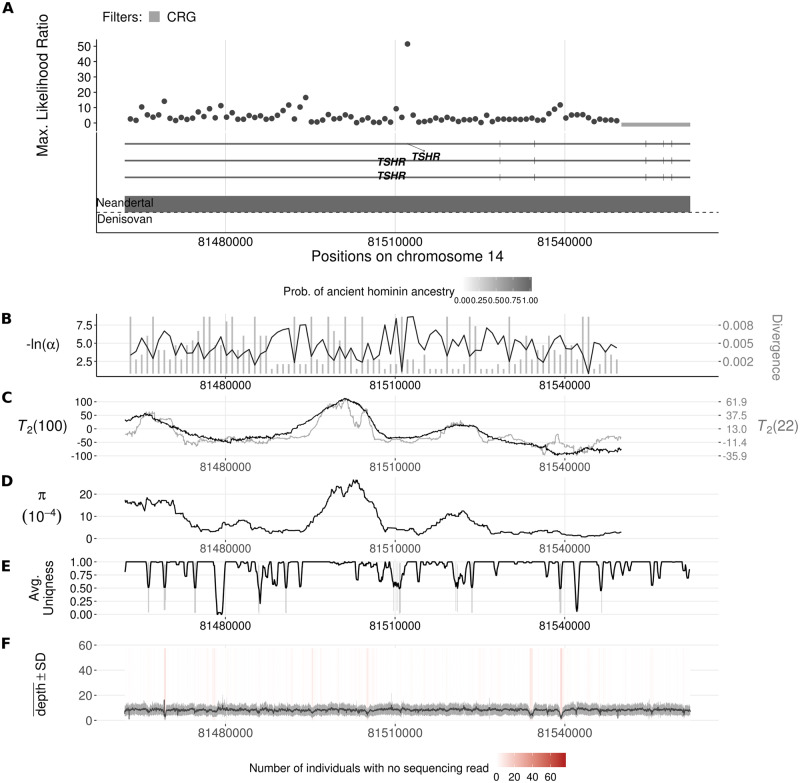
Fig 7. Introgression sweep signals, tracks of Neanderthal or Denisovan ancestry, parameter estimates, and sequencing properties across the 100 kb region on chromosome 14 covering the TSHR gene in CEU.
A. Likelihood ratio test statistic computed from Model 1 of VolcanoFinder on data on within-CEU polymorphism and substitutions with respect to chimpanzee. Horizontal light gray bars correspond to regions that were filtered based on mean CRG. Gene tracts and labels for key genes are depicted below the plot, with the wider bars representing exons. Tracks of putative regions with Neanderthal (above the horizontal line) or Denisovan (below the horizontal line) ancestry are located below gene diagrams. Higher probabilities of Neanderthal or Denisovan ancestry are depicted with darker colored bands (data from [22]). Non-synonymous mutations with Neanderthal are indicated in red. B. Values for α and divergence D corresponding to the maximum likelihood estimate of the data. Black line corresponds to −ln(α) and vertical gray bars correspond to estimated D. C. Likelihood ratio test statistic computed from T2 of BALLET on data on within-CEU polymorphism and substitutions with respect to chimpanzee using windows of 100 (black) or 22 (gray) informative sites on either side of the test site. D. Mean pairwise sequence difference () computed in five kb windows centered on each polymorphic site. E. Mappability uniqueness scores for 35 nucleotide sequences across the region. F. Mean sequencing depth across the 99 CEU individuals as a function of genomic position, with the gray ribbon indicating standard deviation. The background heatmap displays the number of individuals devoid of sequencing reads as a function of genomic position, with darker shades of red indicating a greater number of individuals with no sequencing reads.

