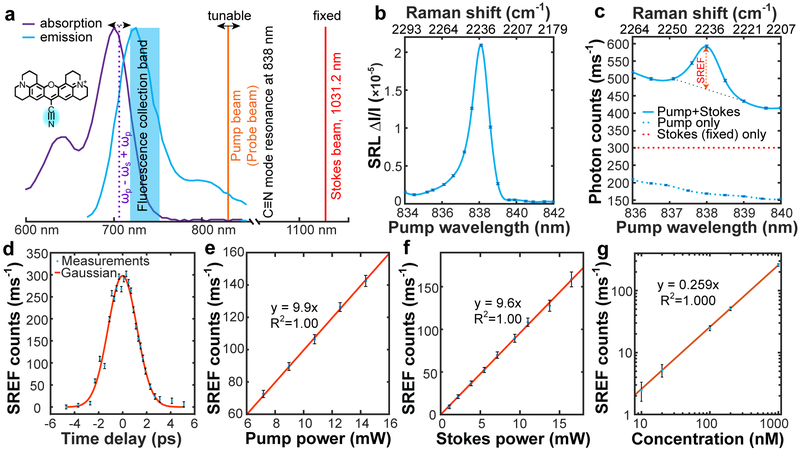
Fig.2 ∣. Stimulated Raman excited fluorescence (SREF) spectroscopy.
a, SREF experimental scheme on Rhodamine 800 (Rh800). Absorption (purple) and emission (blue) spectra of Rh800 in DMSO are shown, together with the tunable pump beam (orange), the fixed Stokes beam at 1031.2-nm (red) and the energy level of (ωp - ωs) + ωp (purple dash). Pump beam is also used as the probe beam. b, SRS spectrum for C≡N vibration of 1-mM Rh800 solution in DMSO. c, SREF excitation spectrum of 500-nM Rh800 solution in DMSO (blue solid). Pure SREF signal size is indicated. Pump-only (blue dash) and Stokes-only (red dash) excitation results are also shown. d, Pure SREF signal as a function of the relative time delay between pump and Stokes pulses. e, Pump-power dependence of pure SREF signal. Stokes power set to 6 mW. f, Stokes-power dependence of pure SREF signal. Pump power set to 6 mW. g, Dependence of pure SREF signals on Rh800 concentrations in DMSO. In b, c, d and g, Ppump and PStokes are 12 mW and 13 mW, respectively. From b to g, the error bars represent 95% confidence intervals of the mean values of normal distributions fitted by 100 independent measurements, respectively.

