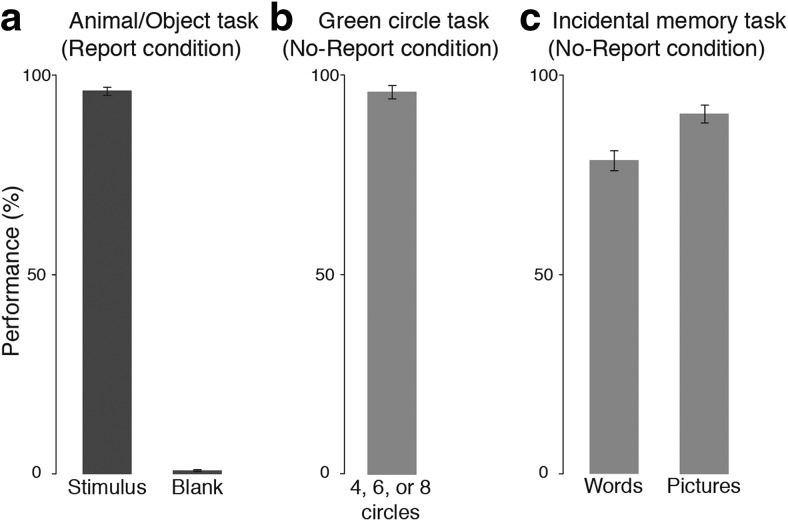
Figure 6.
Behavioral results from experiment 2. In all plots, the percentage correct (i.e., performance) is plotted on the y-axis. a, Performance on the animal/object/nothing task in the report condition. On the x-axis are the different experimental conditions corresponding to when the target stimulus was present or absent (i.e., blank). b, Performance on the green circle counting task in the no-report condition. c, Performance on the incidental memory task in the no-report condition for both word and picture stimuli. All error bars represent the standard deviation.

