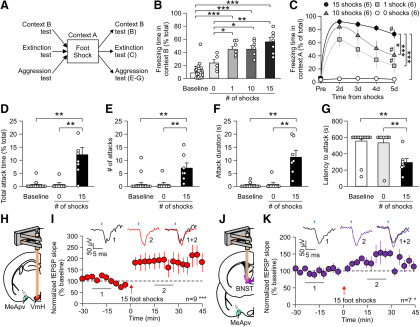
Figure 11.
Traumatic stress induces attack behavior and potentiation of MeApv–VmH and MeApv–BNST synapses. A, Experimental protocol for behavioral testing after foot shock. Baseline behavior was obtained before foot shock. Separate groups of mice were used for different behavior testing. B, C, Fifteen foot shocks enhance fear memory (B) and induce long-lasting fear memory (C). B, Analysis of freezing behavior in Context B for mice before foot shock and after receiving no, 1, 10, or 15 foot shocks in Context A followed by 1 foot shock in Context B. One-way ANOVA was used for statistical analysis across groups: F(4,53) = 41.560, p < 0.001, n = 24 (baseline shocks), 5 (0 shocks), 6 (1 shocks), 6 (10 shocks), 7 (15 shocks). Holm–Sidak was used for post hoc multiple comparisons between groups. C, Analysis of freezing behavior across days in Context A for mice before foot shock and after receiving no, 1, 10, or 15 foot shocks in Context A on day 1. One-way ANOVA was used for statistical analysis across days for each condition: F(4,25) = 0.845 for 0 shocks, 6.292 for 1 shock, 16.325 for 10 shocks, 56.447 for 15 shocks; p = 0.510 for 0 shocks, p < 0.001 for 1 shock, p < 0.001 for 10 shocks, p < 0.001 for 15 shocks; n = 6 mice for each condition. One-way ANOVA was used for analysis of group differences on day 5: F = 14.257, p < 0.001. #p < 0.05, statistical significance within group. *Statistical significance between groups on day 5. D–G, Analysis of aggressive behavior for mice receiving no or 15 foot shocks. One-way ANOVA was used for statistical analysis before and after no or 15 foot shocks. H, J, Illustration for the viral spread (green areas) and optrode placement (pink bars). I, K, Normalized slopes of light-evoked fEPSPs recorded at the VmH (I) or BNST (K) before and after foot shock. Each data point represents the average slope of the late component of 9 evoked fEPSPs. Repeated-measures ANOVA was used for statistical analysis across time points: F(24,200) = 2.622, p < 0.001 (VmH); F(24,150) = 1.638, p = 0.04 (BNST). Two-tailed paired Student's t test was used to identify time points significantly different from baseline. Animal number is indicated in each panel in parentheses. Data are mean ± SEM. *p < 0.05. **p < 0.01. ***p < 0.001.

