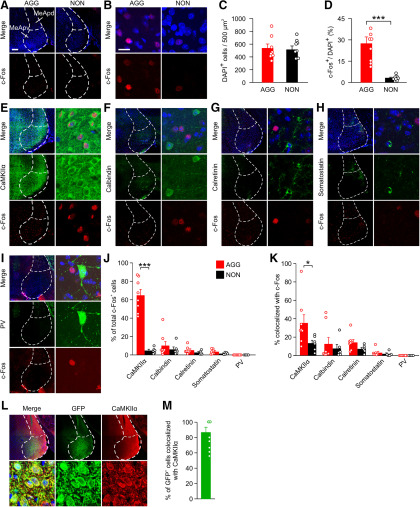
Figure 2.
CaMKIIα+ neurons of the MeApv are activated by aggression priming. Mice (9 weeks of age) were placed in the test cage and either allowed to freely interact with a submissive conspecific male for 10 min or left alone in the cage for the same amount of time. The mice were perfused 60 min after the interaction period for immunostaining. In some images, boundaries can be seen between two adjacent areas due to uneven illumination between tiles. A, B, Representative images of brain sections of c-Fos+ cells in the MeApv from aggressive (AGG, n = 8) or nonattacking control (NON, n = 8) animals after aggression priming. C, Quantification of total number of DAPI+ cells for A and B. Two-tailed paired Student's t test was used for statistical analysis: t(14) = 0.0706, p = 0.945. D, Quantification of c-Fos+ cells for A and B. Mann–Whitney test was used for statistical analysis of Test 1 to Test 2: U = 0.000, p < 0.001. E–I, Representative images of brain sections from AGG mice costained for c-Fos and DAPI along with CaMKIIα (E), calretinin (F), calbindin (G), somatostatin (H), or PV (I). J, K, Quantification of c-Fos+ cells for each cell type from AGG (n = 8) or NON mice (n = 6) after aggression priming. % of c-Fos+ cells that colocalize with the indicated antibodies are shown in J. Mann–Whitney test was used for statistical analysis of versus NON: CaMKIIα, U = 0.000, p < 0.001; calretinin, U = 20.000, p = 0.662; calbindin, t(11) = 1.291, p = 0.223; somatostatin, t(10) = 1.453, p = 0.177; PV, U = 14.000, p = 1.000. % of cells positive for each antibody that colocalize with c-Fos are shown in K. Mann–Whitney test was used for statistical analysis of AGG versus NON: CaMKIIα, t(12) = 2.537, p = 0.0261; calretinin, t(12) = −0.944, p = 0.364; calbindin, t(12) = −1.968, p = 0.0727; somatostatin, U = 12.000, p = 0.432; PV, U = 14.000, p = 1.000. L, M, vGlut2+ cre-line mice (7 weeks of age) were injected with cre-dependent GFP AAV into the MeApv and then used for immunolabeling 3 weeks later. L, Representative images of brain sections from GFP-injected animals stained for CaMKIIα. In some images, boundaries can be seen between two adjacent areas due to uneven illumination between tiles. M, Quantification of L showing % of GFP+ cells that are positive for CaMKIIα. Only cells within the MeApv were counted. Scale bars: A, 2 mm; B, 100 μm. Data are mean ± SEM. *p < 0.05, ***p < 0.001.

