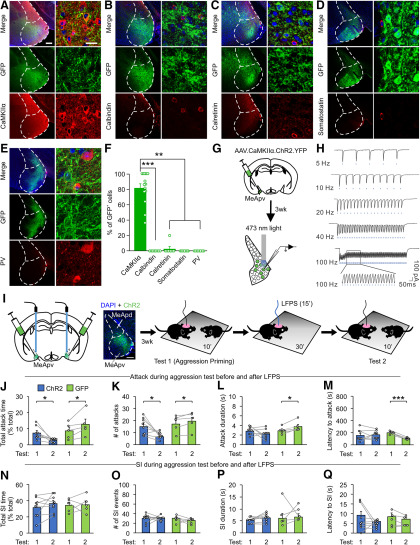
Figure 3.
LFPS of CaMKIIα+ neurons of the MeApv suppresses aggression priming. Mice (7 weeks of age) were bilaterally injected with GFP or ChR2 AAV under control of the CaMKIIα promoter into the MeApv and then used for immunolabeling (A–F), slice electrophysiology (G,H), or aggression testing (I–Q) 3 weeks later. A–E, Representative images of brain sections from GFP-injected animals stained for CaMKIIα (A, n = 14 mice), calretinin (B, n = 8 mice), calbindin (C, n = 7 mice), somatostatin (D, n = 7 mice), or PV (E, n = 7 mice). In some images, boundaries can be seen between two adjacent areas due to uneven illumination between tiles. Scale bars: A, low-magnification images (left), 2 mm; high-magnification images (right), 100 μm. F, Quantification of A–E showing % of GFP+ cells that are positive for the indicated antibodies. Only cells within the MeApv were counted. Kruskal-Wallis one-way ANOVA on Ranks was used for statistical analysis of antibodies colocalized with GFP: H4 = 38.509, p < 0.001. Dunn's method was used for pairwise multiple comparisons: CaMKIIα versus calretinin, p <0.001; CaMKIIα versus calbindin, p = 0.006; CaMKIIα versus somatostatin, p = 0.002; CaMKIIα versus PV, p = 0.006. All other comparisons are not statistically significant. G, H, Experimental schedule for electrophysiological recordings of optically evoked postsynaptic currents in slices containing the MeApv. MeApv neurons were stimulated with light (2 ms pulse duration, 473 nm, 15 mw/mm2) to induce EPSCs (H). I, Experimental schedule for viral injection, optical fiber placement, and LFPS administration before second aggression test. Each mouse was stimulated only once. In the left diagram, the green area in the MeApv represents the viral spread. Blue stick represents the location of optical fibers. Representative image of ChR2 expression in the MeApv. Scale bar, 200 μm. J–Q, The effect of LFPS on primed aggressive behavior (J–M) and nonaggressive social interaction (N–Q). Two-tailed paired Student's t test was used to compare aggression Test 1 to Test 2 for AGG (n = 8) and GFP (n = 5) mice. AGG attack in ChR2 mice: J, t(7) = 2.925, p = 0.022; K, t(7) = 2.934, 0.022; L, t(7) = 1.310, p = 0.232; M, t(7) = −0.365, p = 0.726. AGG attack in GFP mice: J, L, t(4) = −2.784, p = 0.050; M, t(4) = −3.539, p = 0.024; N, t(4) = −3.644, p = 0.022; O, t(4) = 10.871, p < 0.001. SI in ChR2 mice: J, t(7) = −1.283, p = 0.240; K, t(7) = 0.089, 0.932; L, t(7) = −1.724, p = 0.128. SI in GFP: J, t(4) = −0.152, p = 0.886; K, t(4) = 0.617, p = 0.571; L, t(4) = −0.620, p = 0.569; M, t(4) = 1.500, p = 0.208. Data are mean ± SEM. *p < 0.05. **p < 0.01. ***p < 0.001.

