Figure 4.
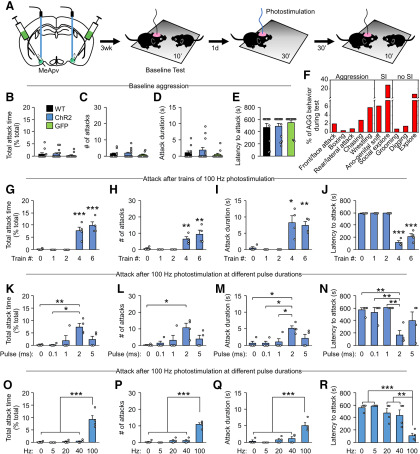
HFPS of MeApv neurons causes an enhancement of aggressive behavior. A, Experimental schedule for optical stimulation and aggression testing. Left, Green area in the MeApv represents the viral spread. Blue stick represents the location of optical fibers. B–E, Baseline aggression of noninjected and virus-injected mice. One-way ANOVA was used for statistical analysis across groups: n = 11 WT, 13 ChR2, and 11 GFP mice; B, F(2,33) = 0.656, p = 0.526; C, F(2,33) = 0.561, p = 0.576; D, F(2,33) = 1.077, p = 0.352; E, F(2,33) = 0.639, p = 0.534. F, Percentage of stereotyped behaviors performed during aggression test 30 min after photostimulation of the MeApv using 4 trains (50 pulses per train) of 2 ms light pulses at 100 Hz (HFPS). G–R, The effect of 100 Hz stimulation with different train numbers (G–J, n = 4 mice for each group), pulse durations (K–N, n = 4 mice for each group), and frequencies (O–R, n = 4 mice for each group) on aggressive behavior. One-way ANOVA was used for statistical analysis across groups: F(4,15) = 22.73 for G, 10.028 for H, 8.569 for I, 116.496 for J, 5.386 for K, 3.496 for L, 4.826 for M, 7.178 for N, 25.272 for O, 44.897 for P, 13.294 for Q, 12.212 for R; p < 0.001 for G, p < 0.001 for H, p < 0.001 for I, p <0.001 for J, p = 0.007 for K, p = 0.033 for L, p = 0.011 for M, p = 0.002 for N, p < 0.001 for O, p < 0.001 for P, p < 0.001 for Q, p < 0.001 for R. Holm–Sidak correction was used for multiple comparisons between trains. Data are mean ± SEM. *p < 0.05, **p < 0.01, ***p < 0.001.

