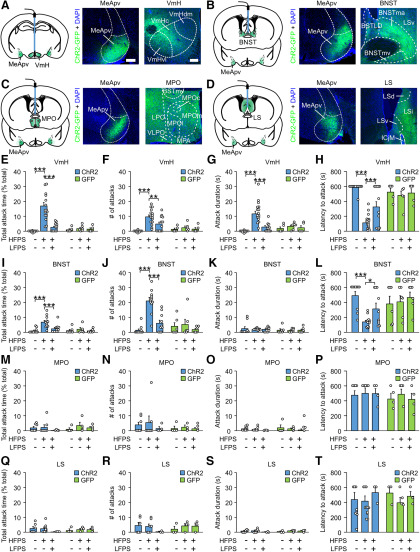
Figure 7.
HFPS of projections from the MeApv to the VmH and BNST promotes aggression. Mice were pair-housed for 8 weeks after surgery, before stimulating projections from the MeApv to the VmH, BNST, MPO, or LS (HFPS alone or HFPS followed by LFPS). Optical stimulation was applied 30 min before introduction of conspecifics and each animal was only stimulated once. A–D, Illustrations for the viral spread (green areas) and optical fiber placement (blue sticks), and representative images of ChR2 expression at the MeApv and the projection areas of MeApv neurons. Scale bars: A (A–D) left, 1 mm; right, 100 μm. E–H, The effect of HFPS and HFPS + LFPS at the VmH on aggressive behavior (n = 12 ChR2 unstimulated, 16 ChR2 HFPS, 13 ChR2 HFPS + LFPS, 5 GFP unstimulated, 6 ChR2 HFPS, 5 ChR2 HFPS + LFPS mice). Two-way ANOVA was used for statistical analysis across groups. For ChR2 versus GFP: F(1,52) = 11.466 for E, 9.567 for F, 4.982 for G, 5.043 for H; p < 0.001 for E, p = 0.003 for F, p = 0.030 for G, p = 0.029 for H. For sham versus stimulated mice: F(2,52) = 13.311 for E, F(2,52) = 9.552 for F, F(2,52) = 13.627 for G, F(2,52) = 5.333 for H; p < 0.001 for E, p < 0.001 for F, p < 0.001 for G, p = 0.008 for H. For interaction between all groups: F(2,52) = 10.851 for E, 5.1 for F, 7.962 for G, 13.082 for H; p < 0.001 for E, p = 0.009 for F, p < 0.001 for G, p < 0.001 for H. Holm–Sidak was used for post hoc multiple comparisons between groups. I–L, The effect of HFPS and HFPS + LFPS at the BNST on aggressive behavior (n = 10 ChR2 unstimulated, 11 ChR2 HFPS, 10 ChR2 HFPS + LFPS, 6 GFP unstimulated, 6 GFP HFPS, 6 GFP HFPS + LFPS mice). Two-way ANOVA was used for statistical analysis across groups. For ChR2 versus GFP: F(1,43) = 6.997 for I, 16.99 for J, 2.414 for K, 0.247 for L; p = 0.011 for I, p < 0.001 for J, p = 0.128 for K, p = 0.622 for L. For sham versus stimulated mice: F(2,43) = 5.718 for I, 18.861 for J, 0.227 for K, 3.271 for L; p = 0.006 for I, p < 0.001 for J, p = 0.798 for K, p = 0.048 for L. For interaction between all groups: F(2,43) = 3.798 for I, 6.73 for J, 0.737 for K, 23.402 for L; p = 0.03 for I, p = 0.003 for J, p = 0.484 for K, p < 0.001 for L. Holm–Sidak was used for post hoc multiple comparisons between two groups. M–P, The effect of HFPS and HFPS + LFPS at the MPO on aggressive behavior (n = 7 ChR2 unstimulated, 7 ChR2 HFPS, 4 ChR2 HFPS + LFPS, 4 GFP unstimulated, 4 GFP HFPS, 4 GFP HFPS + LFPS mice). Two-way ANOVA was used for statistical analysis across groups. For ChR2 versus GFP: F(1,24) = 0.263 for M, 0.439 for N, 1.506 for O, 0.271 for P; p = 0.613 for M, p = 0.514 for N, p = 0.232 for O, p = 0.607 for P. For sham versus stimulated mice: F(2,24) = 0.611 for M, 0.128 for N, 0.425 for O, 0.476 for P; p = 0.551 for M, p = 0.881 for N, p = 0.659 for O, p = 0.627 for P. For interaction between all groups: F(2,24) = 0.677 for M, 0.273 for N, 1.306 for O, 0.300 for P; p = 0.518 for M, p = 0.764 for N, p = 0.289 for O, p = 0.744 for P. Holm–Sidak was used for post hoc multiple comparisons between two groups. Q–T, The effect of HFPS and HFPS + LFPS at the LS on aggressive behavior (n = 6 ChR2 unstimulated, 7 ChR2 HFPS, 3 ChR2 HFPS + LFPS, 3 GFP unstimulated, 4 GFP HFPS, 3 GFP HFPS + LFPS mice). Two-way ANOVA was used for statistical analysis across groups. For ChR2 versus GFP: F(1,20) = 0.108 for Q, 0.0001 for R, 0.0122 for S, 0.383 for T; p = 0.745 for Q, p = 0.991 for R, p = 0.913 for S, p = 0.543 for T. For sham versus stimulated mice: F(2,20) = 0.470 for Q, 0.574 for R, 0.852 for S, 0.628 for T; p = 0.632 for Q, p = 0.573 for R, p = 0.442 for S, p = 0.544 for T. For interaction between all groups: F(2,20) = 0.725 for Q, 1.067 for R, 0.721 for S, 0.476 for T; p = 0.497 for Q, p = 0.363 for R, p = 0.498 for S, p = 0.628 for T. Holm–Sidak was used for post hoc multiple comparisons between two groups. Data are mean ± SEM. *p < 0.05, **p < 0.01, ***p < 0.001.

