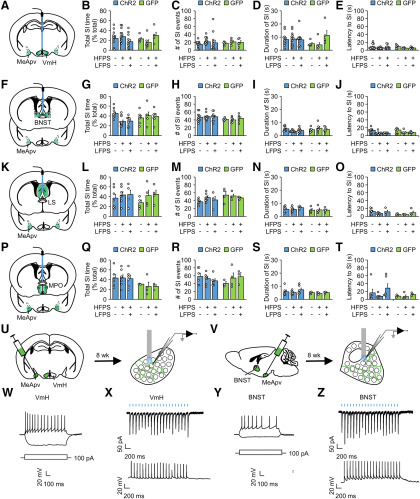
Figure 8.
Optogenetic stimulation of MeApv projection areas depolarizes the VmH and BNST neurons and has no effect on nonaggressive social interaction. A, F, K, P, Illustrations for the viral spread (green areas) and optical fiber placement (blue sticks). B-E, G-J, L-O, Q-T, Analysis of nonaggressive social interaction during the 10 min aggression test. B–E, The effect of HFPS and HFPS + LFPS at the VmH on aggressive behavior (n = 12 ChR2 unstimulated, 16 ChR2 HFPS, 13 ChR2 HFPS + LFPS, 5 GFP unstimulated, 6 ChR2 HFPS, 5 ChR2 HFPS + LFPS mice). Two-way ANOVA was used for statistical analysis across groups. For ChR2 versus GFP: F(1,52) = 0.270 for B, 0.002 for C, 1.741 for D, 1.143 for E; p = 0.606 for B, p = 0.963 for C, p = 0.193 for D, p = 0.290 for E. For sham versus stimulated mice: F(2,52) = 0.242 for B, 1.615 for C, 2.610 for D, 1.435 for E; p = 0.786 for B, p = 0.209 for C, p = 0.083 for D, p = 0.247 for E. For interaction between all groups: F(2,52) = 3.020 for B, 0.046 for C, 3.116 for D, 0.309 for E; p = 0.057 for B, p = 0.955 for C, p = 0.053 for D, p = 0.735 for E. Holm–Sidak was used for post hoc multiple comparisons between groups. G–J, The effect of HFPS and HFPS + LFPS at the BNST on aggressive behavior (n = 10 ChR2 unstimulated, 11 ChR2 HFPS, 10 ChR2 HFPS + LFPS, 6 GFP unstimulated, 6 GFP HFPS, 6 GFP HFPS + LFPS mice). Two-way ANOVA was used for statistical analysis across groups. For ChR2 versus GFP: F(1,43) = 1.420 for G, 3.978 for H, 1.624 for I, 0.780 for J; p = 0.240 for G, p = 0.052 for H, p = 0.209 for I, p = 0.382 for J. For sham versus stimulated mice: F(2,43) = 1.407 for G, 0.165 for H, 0.298 for I, 3.214 for J; p = 0.256 for G, p = 0.848 for H, p = 0.744 for I, p = 0.052 for J. For interaction between all groups: F(2,43) = 3.567 for G, 0.150 for H, 2.156 for I, 0.133 for J; p = 0.037 for G, p = 0.861 for H, p = 0.128 for I, p = 0.876 for J. Holm–Sidak was used for post hoc multiple comparisons between two groups. L–O, The effect of HFPS and HFPS + LFPS at the MPO on aggressive behavior (n = 7 ChR2 unstimulated, 7 ChR2 HFPS, 4 ChR2 HFPS + LFPS, 4 GFP unstimulated, 4 GFP HFPS, 4 GFP HFPS + LFPS mice). Two-way ANOVA was used for statistical analysis across groups. For ChR2 versus GFP: F(1,24) = 0.212 for L, 4.039 for M, 1.288 for N, 3.254 for O; p = 0.649 for L, p = 0.056 for M, p = 0.268 for N, p = 0.084 for O. For sham versus stimulated mice: F(2,24) = 1.158 for L, 0.622 for M, 0.192 for N, 1.417 for O; p = 0.331 for L, p = 0.545 for M, p = 0.827 for N, p = 0.262 for O. For interaction between all groups: F(2,24) = 0.206 for L, 0.995 for M, 0.286 for N, 0.656 for O; p = 0.816 for L, p = 0.384 for M, p = 0.754 for N, p = 0.528 for O. Holm–Sidak was used for post hoc multiple comparisons between two groups. Q–T, The effect of HFPS and HFPS + LFPS at the LS on aggressive behavior (n = 6 ChR2 unstimulated, 7 ChR2 HFPS, 3 ChR2 HFPS + LFPS, 3 GFP unstimulated, 4 GFP HFPS, 3 GFP HFPS + LFPS mice). Two-way ANOVA was used for statistical analysis across groups. For ChR2 versus GFP: F(1,20) = 2.578 for Q, 0.336 for R, 0.378 for S, 0.591 for T; p = 0.124 for Q, p = 0.569 for R, p = 0.545 for S, p = 0.451 for T. For sham versus stimulated mice: F(2,20) = 0.155 for Q, 0.471 for R, 0.382 for S, 1.207 for T; p = 0.857 for Q, p = 0.631 for R, p = 0.688 for S, p = 0.32 for T. For interaction between all groups: F(2,20) = 0.153 for Q, 0.598 for R, 0.215 for S, 0.437 for T; p = 0.859 for Q, p = 0.56 for R, p = 0.808 for S, p = 0.652 for T. Holm–Sidak was used for post hoc multiple comparisons between two groups. U–Z, Six- to 7-week-old mice were injected with ChR2 AAV into the MeApv. Brain slices containing the VmH (W,X) or BNST (Y,Z) were prepared from injected mice 8 weeks later. Neurons in brain slices were recorded with whole-cell patch-clamp. W, Responses of VmH neurons to injection of 1 s depolarizing and hyperpolarizing currents. X, EPSCs and EPSPs induced by 2 ms,15 mw/mm2 473 nm light pulses delivered at 10 Hz to VmH neurons. Y, Responses of BNST neurons to injection of 1 s depolarizing and hyperpolarizing currents. Z, EPSCs and EPSPs induced by 2 ms,15 mw/mm2 473 nm light pulses delivered at 10 Hz to BNST neurons. Data are mean ± SEM.

