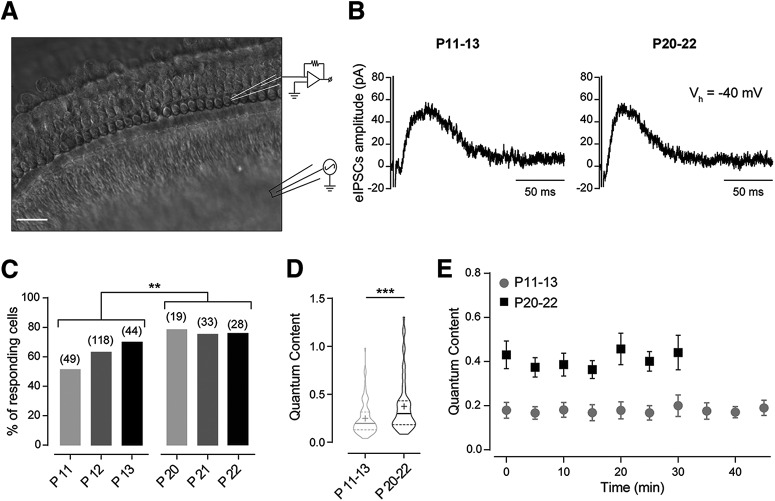
Figure 1.
Synaptic strength at the MOC–OHC synapse increases with postnatal age. A, Schematic representation of the experimental preparation. OHCs from the first row were recorded with a glass electrode during electrical stimulation of the MOC efferent fibers. Scale bar, 20 µm. B, Representative traces of eIPSCs in voltage-clamped OHCs (Vh = −40 mV) at P11–P13 (left) and P20–P22 (right) in response to MOC fiber stimulation at 1 Hz. C, Percentage of responding OHCs on electrical stimulation of the MOC efferent fibers also increases during postnatal development. Numbers over the bars indicate the number of cells tested. χ2 test; **p < 0.01. D, Violin plot for the quantum content of transmitter release at the MOC–OHC synapse (P11–P13, n = 110 cells; P20–P22, n = 62 cells). Solid lines represent the median, and dashed lines represent the interquartile divisions. Mean values are represented with the + symbol. Mann–Whitney test, ***p < 0.001. E, Quantum content versus recording time at both developmental stages (P11–P13, n = 6; P20–P22, n = 5). Repeated-measures ANOVA; no significant differences were found within each developmental stage.

