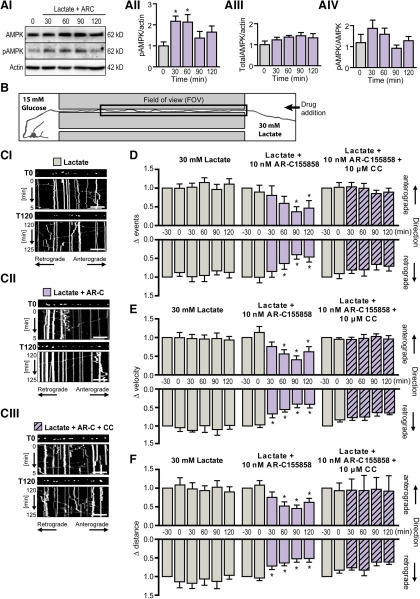
Figure 6.
Establishment of an in vitro microfluidic model of localized nutrient deprivation. AI, Representative Western blot image showing total cellular AMPK levels and its phosphorylation status during localized nutrient deprivation (Lactate+ARC). Beta-actin served as a loading control. AII, Quantification of phosphorylated AMPK (pAMPK) relative to β-actin levels showed a marked increase in pAMPK in response to inhibition of lactate uptake with AR-C188585 within 30 min. AIII, Quantification of total AMPK relative to β-actin. AIV, Quantification of pAMPK relative to total AMPK. *p < 0.05 (one-way ANOVA with Dunnett's multiple-comparison post hoc test). n = 4 from four independent culture preparations. B, Schematic of experimental design. The somatodendritic compartment was exposed to glucose-rich (15 mm) experimental buffer while glucose was substituted with the metabolic equivalent concentration of lactate (30 mm) at the axonal compartment. Mitochondrial mobility was measured in the axon segment contained in the microgroove (FOV) adjacent to the area of drug addition (axonal compartment). The experimental time course illustrated in Figure 2AII was used, with drug addition to the axonal compartment after 60 min baseline recording. Statistical analysis was performed by comparing each time interval to 30 min baseline recording before drug addition (T0). C, Representative kymographs of mitochondrial mobility in the axon segment (FOV) during baseline recording (T0) and 2 h (T120) after treatment of the distal axon with (CI) 30 mm lactate, (CII) lactate and 10 nm AR-C1557858, or (CIII) lactate, AR-C155858 and 10 μm CC. Mito-GFP-tagged mitochondria can be visualized in the still image shown above each kymograph (first image of corresponding time period). Scale bar, 20 μm. D, Inhibition of lactate uptake into the distal axon by addition of AR-C155858 to this region induced a depression in the frequency of retrograde mitochondrial movements (T90) with a milder depression in the frequency of anterograde movement events. This effect was reversed by cotreatment with CC confirming a role for AMPK signaling in nutrient deprivation-induced depression in local mitochondrial transport frequency. E, F, The mean velocity and distance of mitochondrial movement events were first normalized to their respective pretreatment values (T30). E, The velocity of bidirectional mitochondrial transport remained stable for the duration of the experiment in axons exposed distally to lactate as their energy source. AR-C155858 induced a maintained depression of retrograde mitochondrial transport velocity within 30 min (T30), with a milder effect evident in anterograde transport at a later time point (T90). F, AR-C155858 also rapidly reduced the mean distance of retrograde mitochondrial transport (T30) with the mean distance of anterograde transport affected at a later time point (T60). *p ≤ 0.01 (repeated-measures ANOVA with Dunnett's multiple-comparison post hoc test). n = 7 experiments from at least five independent culture preparations.

