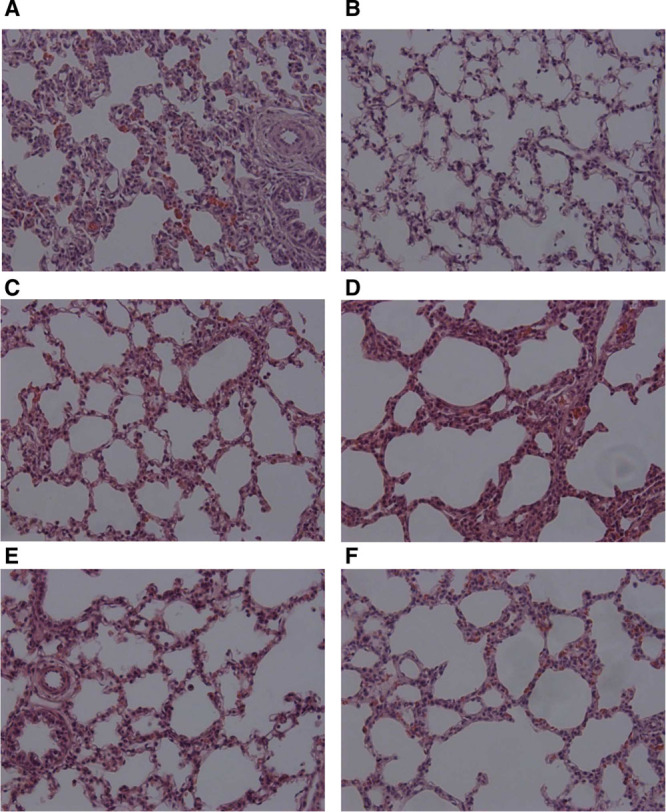
Figure 2.

Photomicrographs (×200 magnification) of representative lung sections from nasal continuous positive airway pressure (A), intubation–surfactant–extubation (Insure) (B), nebulized surfactant (NS) 100 (C), NS200 (D), NS400 (E), and NS600 (F) groups. Panels were obtained from the middle region of the lung.
