
Figure 3: Explanation method performance across 15 different evaluation metrics and three classification models in the chronic kidney disease dataset.
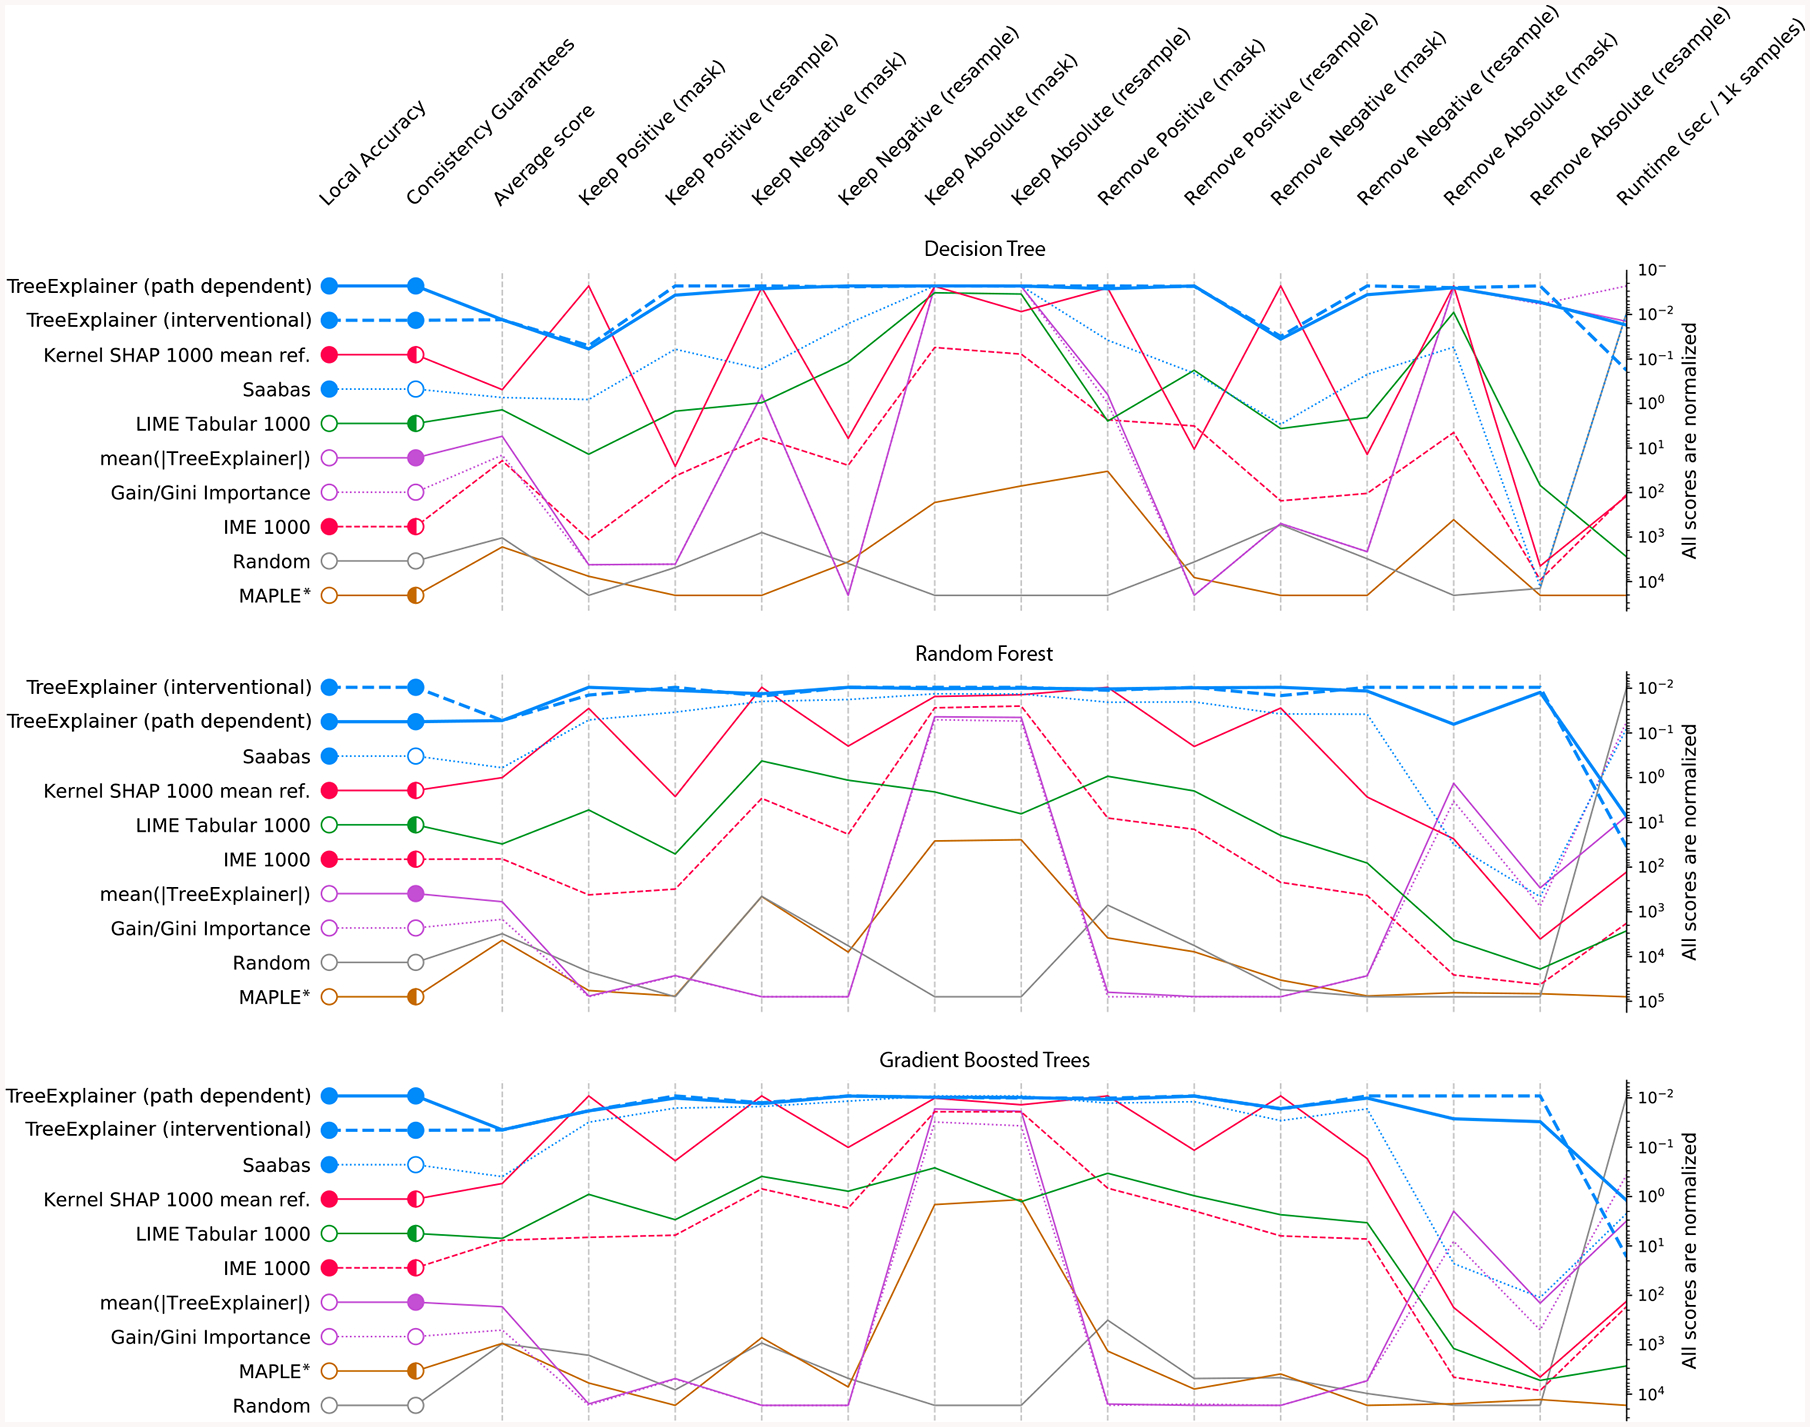
Each column represents an evaluation metric, and each row represents an explanation method. The scores for each metric are scaled between the minimum and maximum value, and methods are sorted by their average score. TreeExplainer outperforms previous approaches not only by having theoretical guarantees about consistency, but also by exhibiting improved performance across a large set of quantitative metrics that measure explanation quality (Methods). When these experiments were repeated for two synthetic datasets, TreeExplainer remained the top-performing method (Supplementary Figures 6 and 7). Note that, as predicted, Saabas better approximates the Shapley values (and so becomes a better attribution method) as the number of trees increases (Methods). *Since MAPLE models the local gradient of a function, and not the impact of hiding a feature, it tends to perform poorly on these feature importance metrics [35].