
Figure 6: Local explanation embeddings support both supervised clustering and interpretable dimensionality reduction.
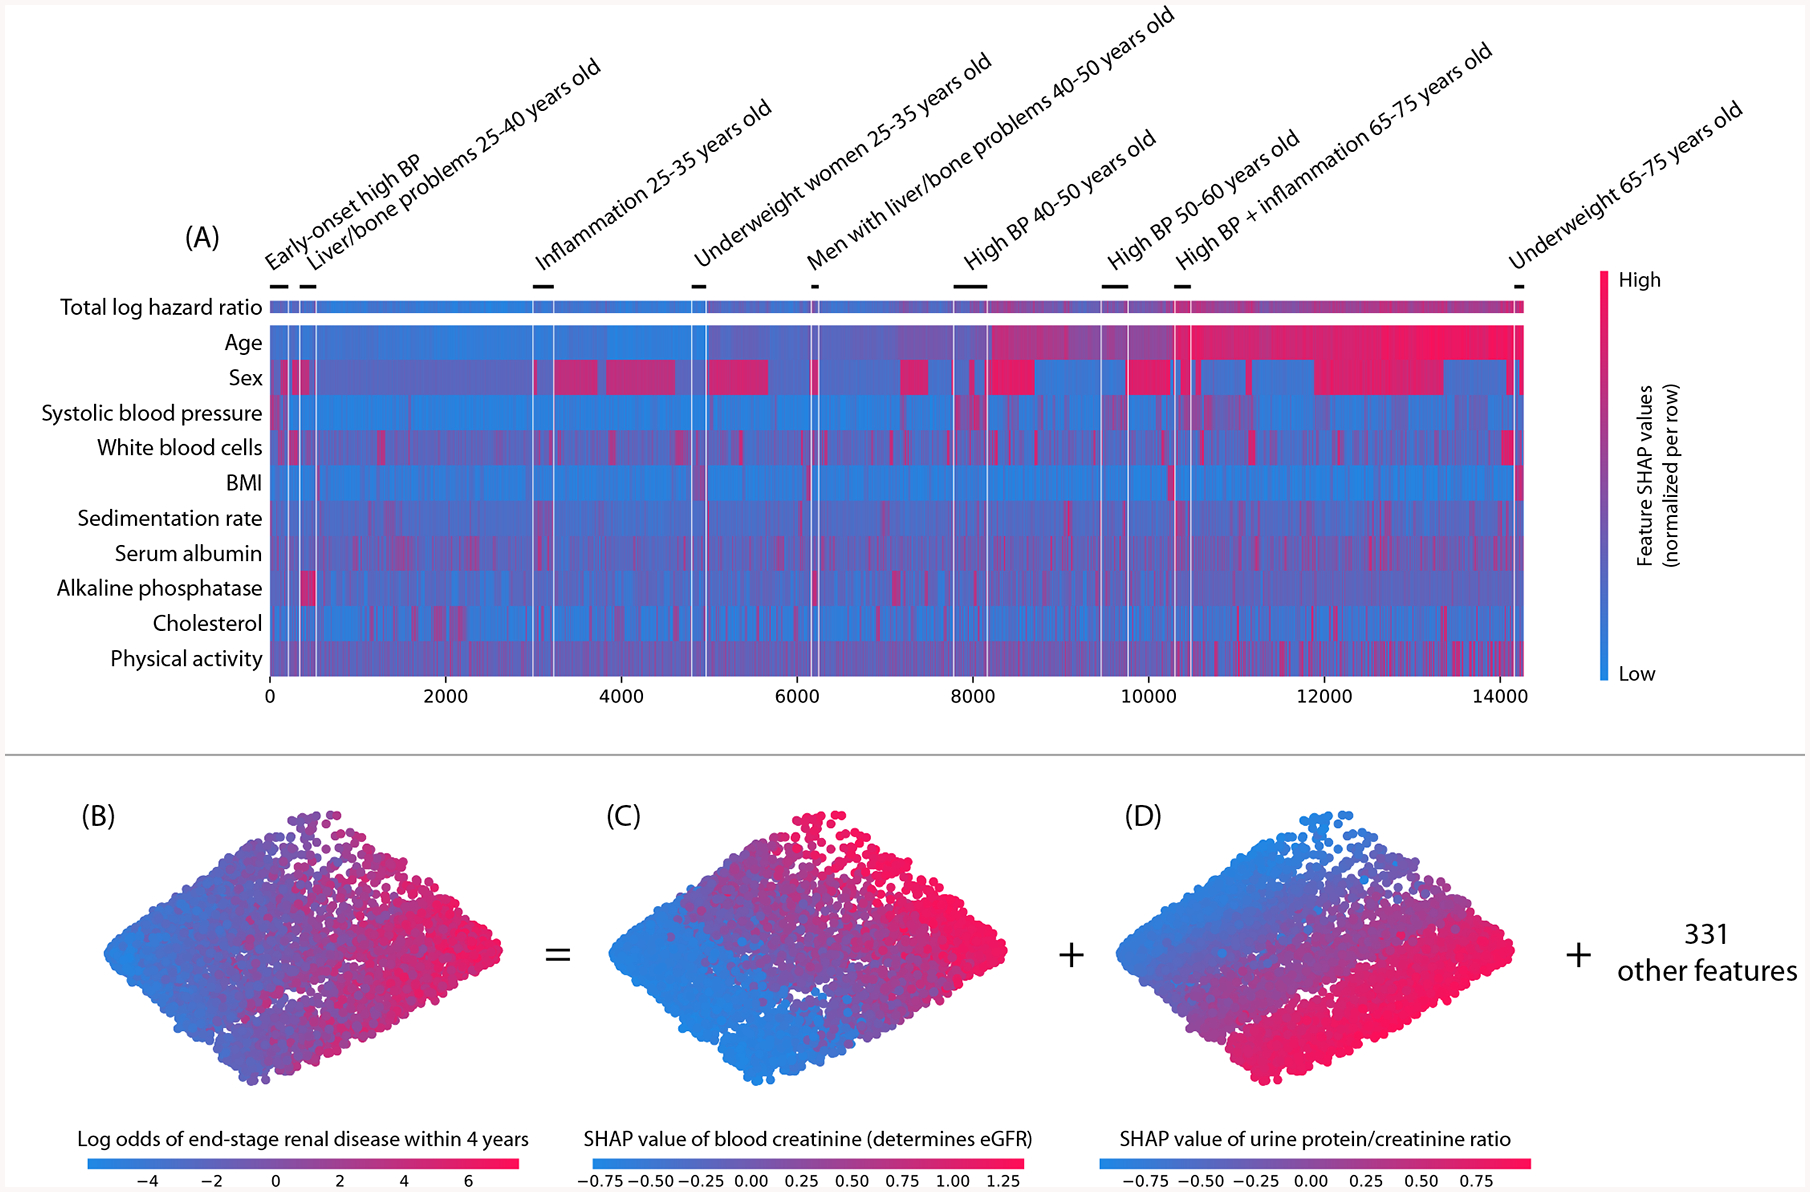
(A) A clustering of mortality study individuals by their local explanation embedding. Columns are patients, and rows are features’ normalized SHAP values. Sorting by a hierarchical clustering reveals population subgroups that have distinct mortality risk factors. (B–D) A local explanation embedding of kidney study visits projected onto two principal components. Local feature attribution values can be viewed as an embedding of the samples into a space where each dimension corresponds to a feature and all axes have the units of the model’s output. The embedding colored by: (B) the predicted log odds of a participant developing end-stage renal disease within 4 years of that visit, (C) the SHAP value of blood creatinine, and (D) the SHAP value of the urine protein/creatinine ratio. Many other features also align with these top two principal components (Supplementary Figure 13), and an equivalent unsupervised PCA embedding is far less interpretable (Supplementary Figure 14)