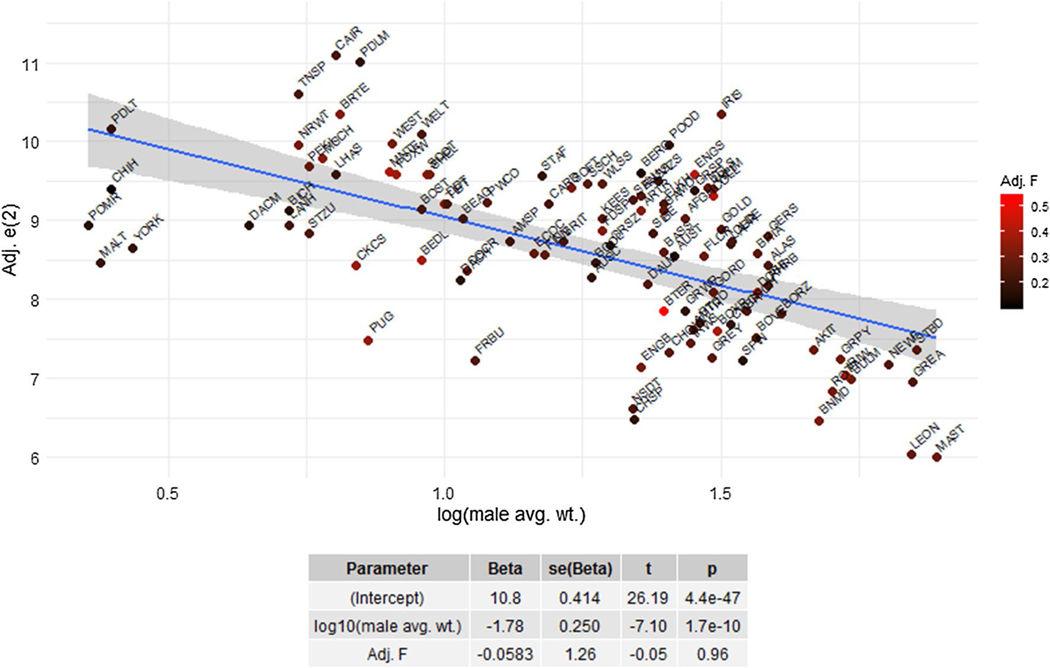
Fig. 4.
Higher coefficients of inbreeding (F) are equally likely in breeds that are longer-lived or shorter-lived than expected based on their size. Life expectancy is plotted against log10(male average weight) for 105 breeds for which inbreeding estimates are also available. Trend line shows expected life expectancy based on regression on size only. Points are colored by breed-average level of inbreeding, such that outbred breeds are black and inbred breeds are red. Regression coefficients from regression of log10(male average weight) and coefficient of inbreeding (F) on adjusted life expectancy are given. Breed abbreviations are given in Table S4 (ESM2)

