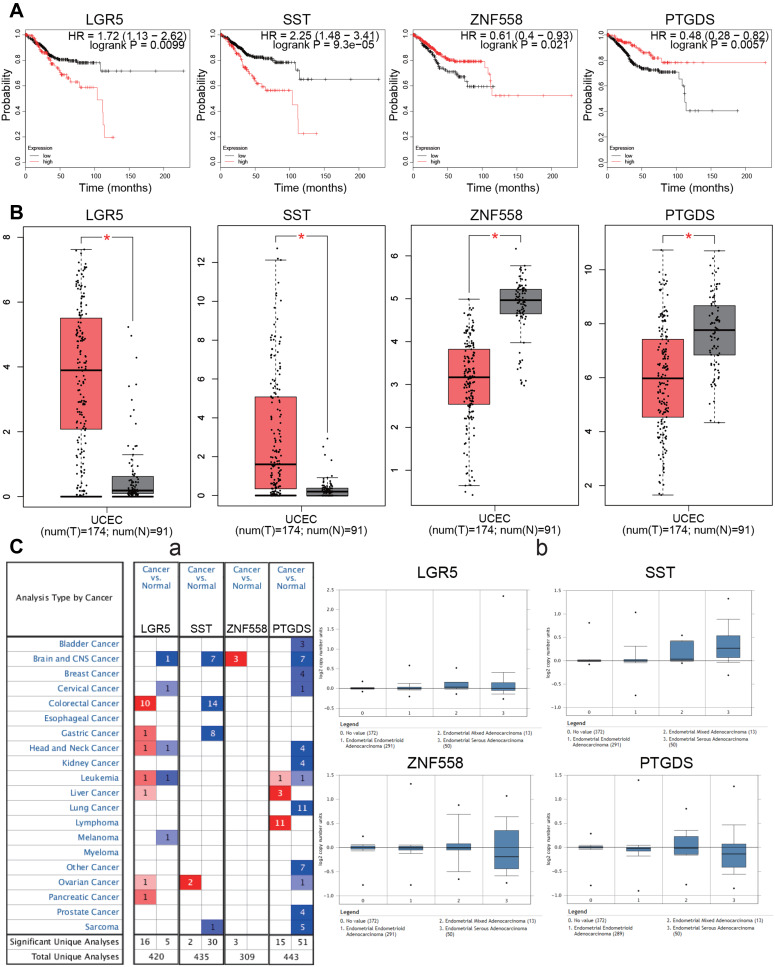
Figure 6.
Survival analysis and differential expression of hub genes. (A) Survival analysis of the hub genes in EC (Kaplan–Meier plot). (B) Differential expression of hub genes analyzed using the GEPIA database. Box plots show mRNA expression of hub genes in EC (red plot) and the corresponding normal tissues (gray plot). *P<0.05. (C) Differential expression of hub genes analyzed using the Oncomine database. (C-a): Differential expression of hub genes in different tumors. The intensity of color (red or blue) is positively correlated with the degree of significance of upregulation or downregulation, respectively. (C-b): Differential expression of hub genes in different pathological types of EC.
Abbreviation: EC, endometrial carcinoma.

