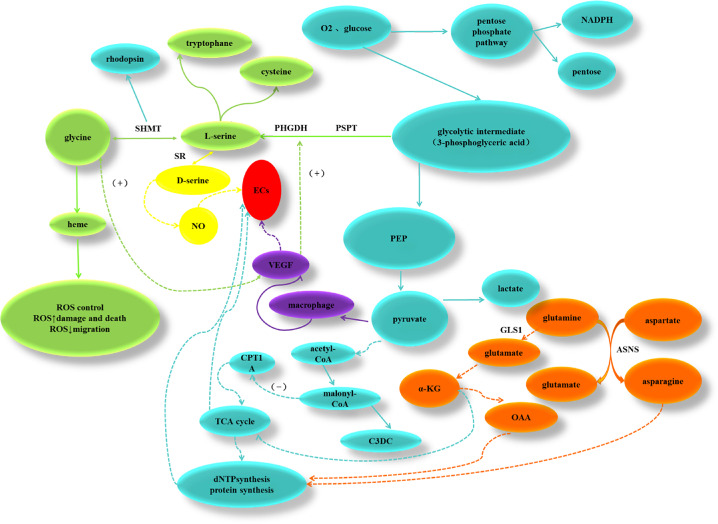
Figure 6.
Schematic diagram of the effect of specific metabolites and metabolic pathways on endothelial cells. Orange indicates amino acids that contributed to the respiratory pathways. Cyan shows conventional TCA cycle pathways. Green presents interconversion of glycine and serine. Abbreviations: α-KG = alpha-ketoglutarate; ASNS = asparagine synthase; CPT1A = carnitine palmitoyltransferase 1a; C3DC = malonyl carnitine; GLS1 = glutaminase 1; OAA = oxaloacetic acid; PEP = phosphoenolpyruvic acid; PSPT = phosphoserine phosphatase; SHMT = serine hydroxymethyltransferase; SR = serine racemase.

