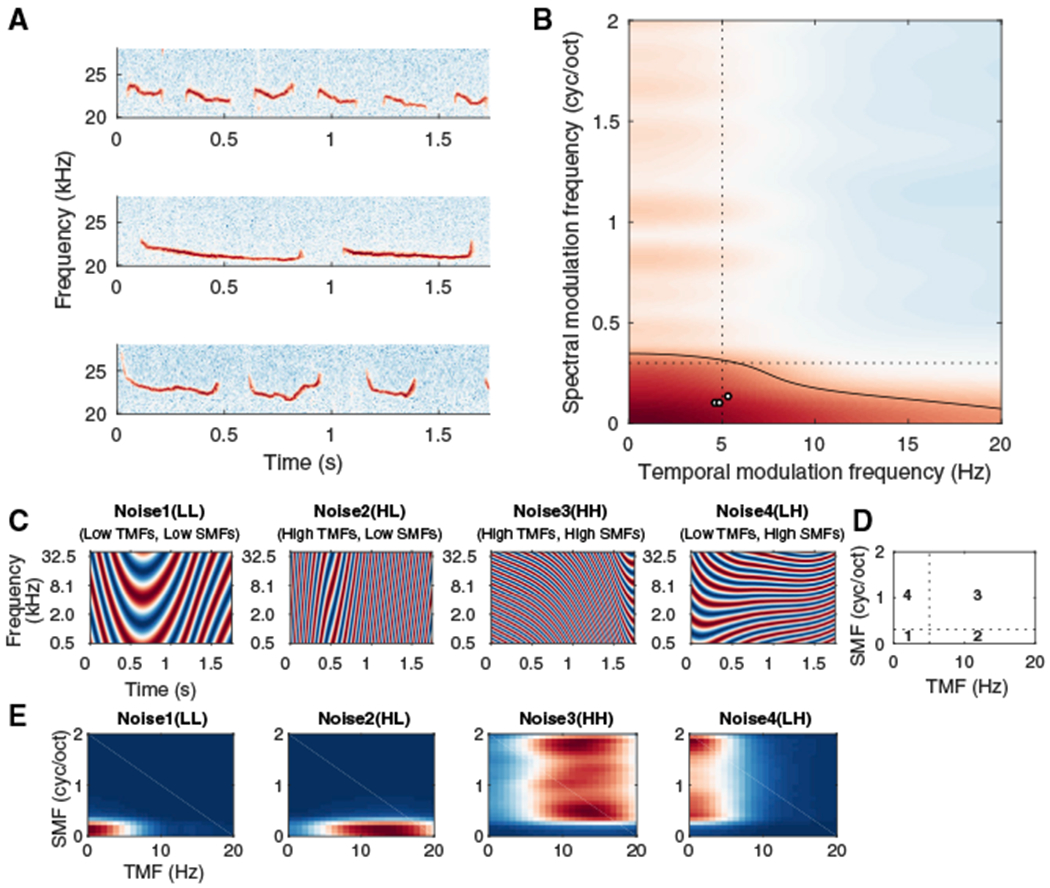
Figure 1. Sound Stimuli of Rat Vocalizations and Biased DMR Noises.

(A) Spectrograms of three rat vocalizations used in this study.
(B) Rat vocalization modulation power spectrum (MPS, mean of 18 different vocalizations). Black contour: 70% of power strength. Black circles: temporal and spectral modulation frequencies (TMFs and SMFs) of the three vocalizations in (A). Dashed lines separate the value ranges of the four biased DMR noises (see D).
(C) Example spectrograms of short segments for the biased DMRs.
(D) Modulation ranges for four biased DMR noises. Noise1, TMFs: 0–5 Hz, SMFs: 0–0.3 cyc/oct; Noise2, TMFs: 5–20 Hz, SMFs: 0–0.3 cyc/oct; Noise3, TMFs: 5–20 Hz, SMFs: 0.3–2 cyc/oct; Noise4, TMFs: 0–5 Hz, SMFs: 0.3–2 cyc/oct.
(E) MPSs of the four biased noises. Color: power on a log scale.
