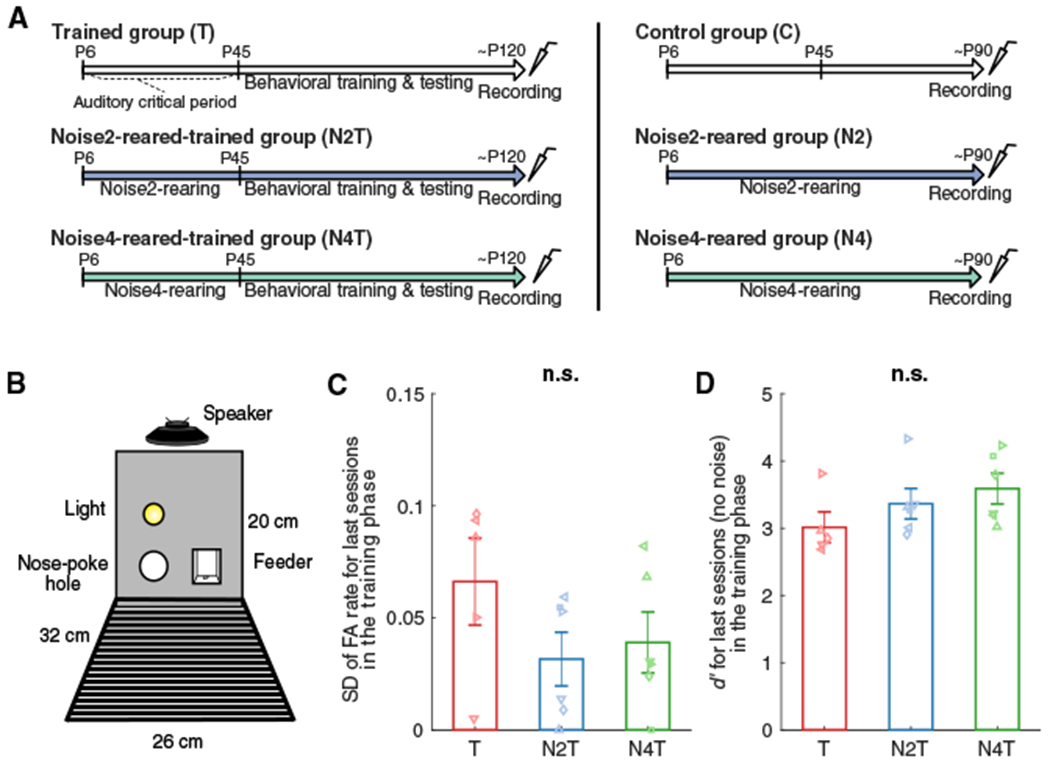
Figure 2. Experimental Design.

(A) Trained and Control groups were raised in a typical rat colony environment while the groups with noise-rearing (N2T, N4T, N2, N4) were raised in the presence of biased DMR noise (~60 dB SPL) from P6. Behavioral training was started at P45 (T, N2T, N4T). Cortical activity was recorded at ~P120 for trained groups and ~P90 for untrained groups.
(B) The behavioral testing chamber contained one nose poke hole (left) and one feeder (right). A loudspeaker was mounted at a height of 20 cm, and a house light was placed 5 cm above the nose poke hole.
(C and D) Standard deviation (SD) of false alarm (FA) rate (C) or sensitivity index (d′) (D) was computed for the last sessions in the training phase (no noise). Bars represent mean values (± SEM) for T (red; n = 5), N2T (blue; n = 6), and N4T (green; n = 6) groups. No group difference was found in SD or d′ (n.s.).
