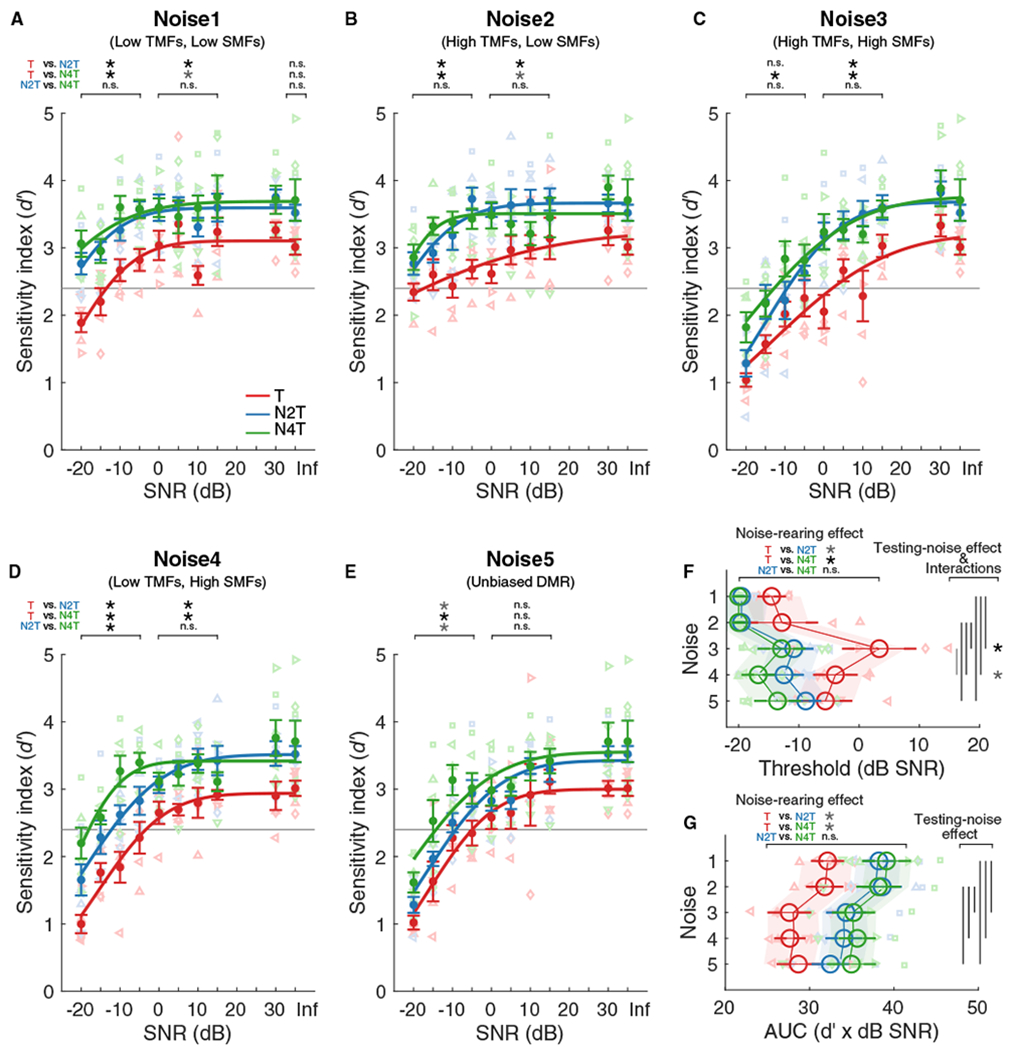
Figure 3. Noise-Rearing Improved Vocalization-in-DMR Detection Performance.

(A–E) Psychometric functions for vocalization detection in Noise1 (A), Noise2 (B), Noise3 (C), Noise4 (D), or Noise5 (E). Individual d′ values derived for the T (red; n = 5), N2T (blue; n = 6), and N4T (green; n = 6) groups are plotted against signal-to-noise ratio (SNR). A cumulative Gaussian distribution was used to fit the functions for the group means (lines). Dots represent mean (±SEM) for each group. The horizontal gray lines indicate the threshold criterion of d′ = 2.4. The asterisks indicate paired comparisons for the range of −20 to −5, 0 to 15, or Inf dB SNR.
(F and G) Large open circles represent mean (±SEM) of threshold (F) or AUC (G) values for each noise type and group, which were obtained by fitting to the functions for individual animals. The shaded areas represent the 2.5%–97.5% confidence intervals of the linear mixed effects model. Vertical lines: testing-noise effects (p < 0.05). Asterisks: differences for T versus N2T and T versus N4T for each noise type; black, p < 0.01, gray, p < 0.05; n.s., not significant.
See Table S1 for details of statistical analysis. See also Figures S1 and S2.
