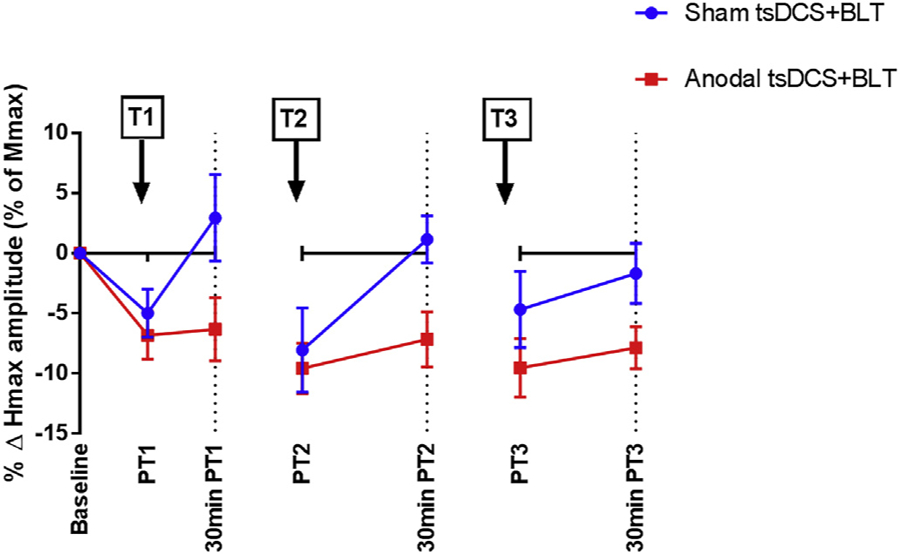
Fig. 3.

Percent change in Soleus H-reflex (Hmax) amplitudes (normalized to Day 1 baseline). H-reflex amplitude was down-regulated in both groups in the immediately post-training period on days 1–3 (PT1, PT2, PT3, respectively). 30 min post-training (30 min PT 1, 30min PT2, 30min PT3), the Hmax/Mmax amplitude remained down-regulated only in the a-tsDCS group (red). (For interpretation of the references to colour in this figure legend, the reader is referred to the Web version of this article.)
