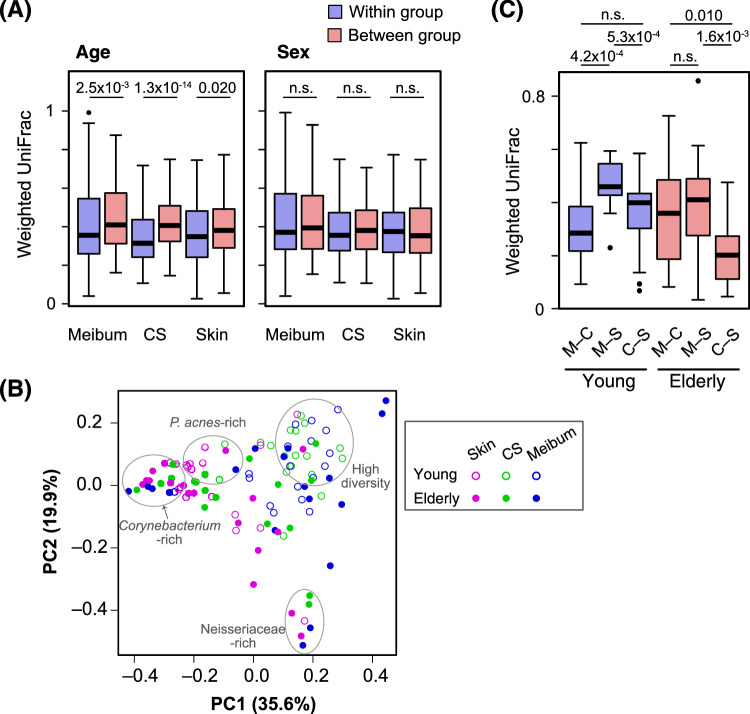
Figure 2.
Analyses based on the weighted UniFrac pairwise distance between samples. (A) Distribution of the pairwise distances. All pairs of the samples from either of meibum, conjunctival sac (CS), or eyelid skin (skin) were divided into “within the same age groups” and “between the different age groups” (left) or “within the same sex groups” and “between the different sex groups” (right). The weighted UniFrac distances of each set of pairs are depicted in the box plot. Blue, pairs within the same age/sex groups; red, pairs between the different age/sex groups. The numbers above the box plots are P values of the Mann-Whitney U test. n.s., not significant (or P > 0.05). (B) A principal coordinate analysis plot based on the weighted UniFrac distance. Samples representing each of the collection sites, and subject age are shown by distinct symbols. Clusters of the samples with characteristic microbiomes are indicated. (C) Weighted UniFrac distances of the samples collected at the three different sites of the same subject. M–C, sample pairs between the meibum and the CS; M–S, sample pairs between the meibum and the skin; C–S, sample pairs between the CS and the skin. The numbers above the box plots are P values of the Wilcoxon signed-rank test. n.s., not significant (or P > 0.05).

