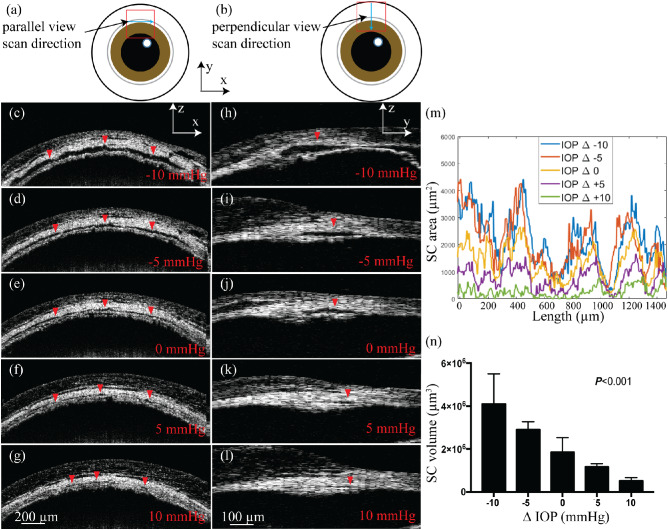
Figure 4.
(a, b) Illustrations of a top view of the mouse eye with positions and directions of the parallel-view and perpendicular-view B-scan images, respectively. (c–g) Parallel-view vis-OCT images under different IOP levels from the position highlighted in panel (a). (h–l) Parallel-view vis-OCT images under different IOP levels from the position highlighted in panel (b). The red arrowheads highlight SC in the B-scan images. (m) Examples of SC cross-sectional area changes at different positions along the canal under different IOP levels. (n) Mean ± standard deviation volumes of 1.5-mm SC segments at IOP levels of –10 mm Hg, –5 mm Hg, 0 mm Hg, +5 mm Hg, and +10 mm Hg with respect to the baseline IOP.

