Figure 2.

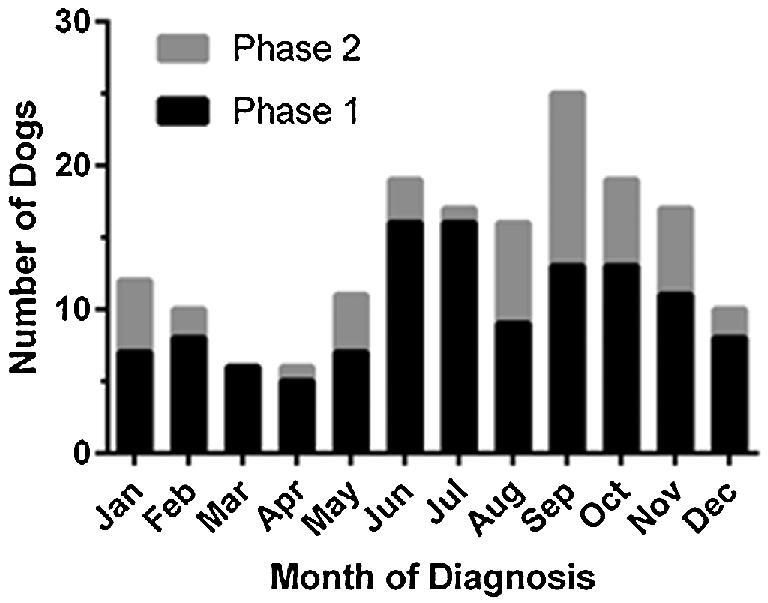
Bar graph depicting the distribution of blastomycosis cases (phase 1 and phase 2) by month of diagnosis. Blastomycosis was diagnosed throughout the year in both study phases, but most cases were diagnosed in summer and fall months.

Bar graph depicting the distribution of blastomycosis cases (phase 1 and phase 2) by month of diagnosis. Blastomycosis was diagnosed throughout the year in both study phases, but most cases were diagnosed in summer and fall months.