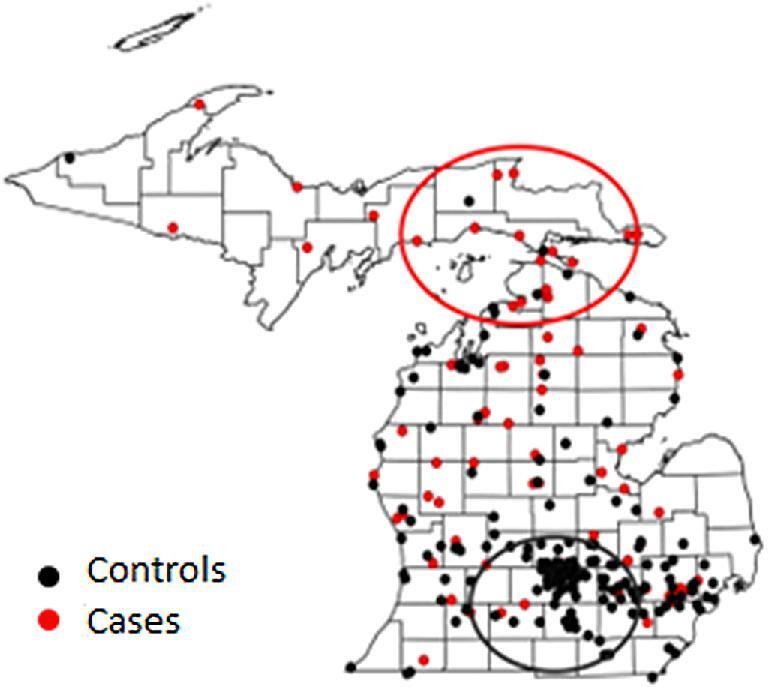
Figure 4.

Distribution map of home and travel addresses for cases and controls in phase 2. Red dots represent the home and travel addresses for the 49 dogs with blastomycosis in study phase 2. Black dots represent the home and travel addresses for the 147 age matched control dogs with conditions other than blastomycosis. The red and black circles depict significant high-risk (P < .001) and low-risk areas (P < .001), respectively, as determined by cluster analysis.
