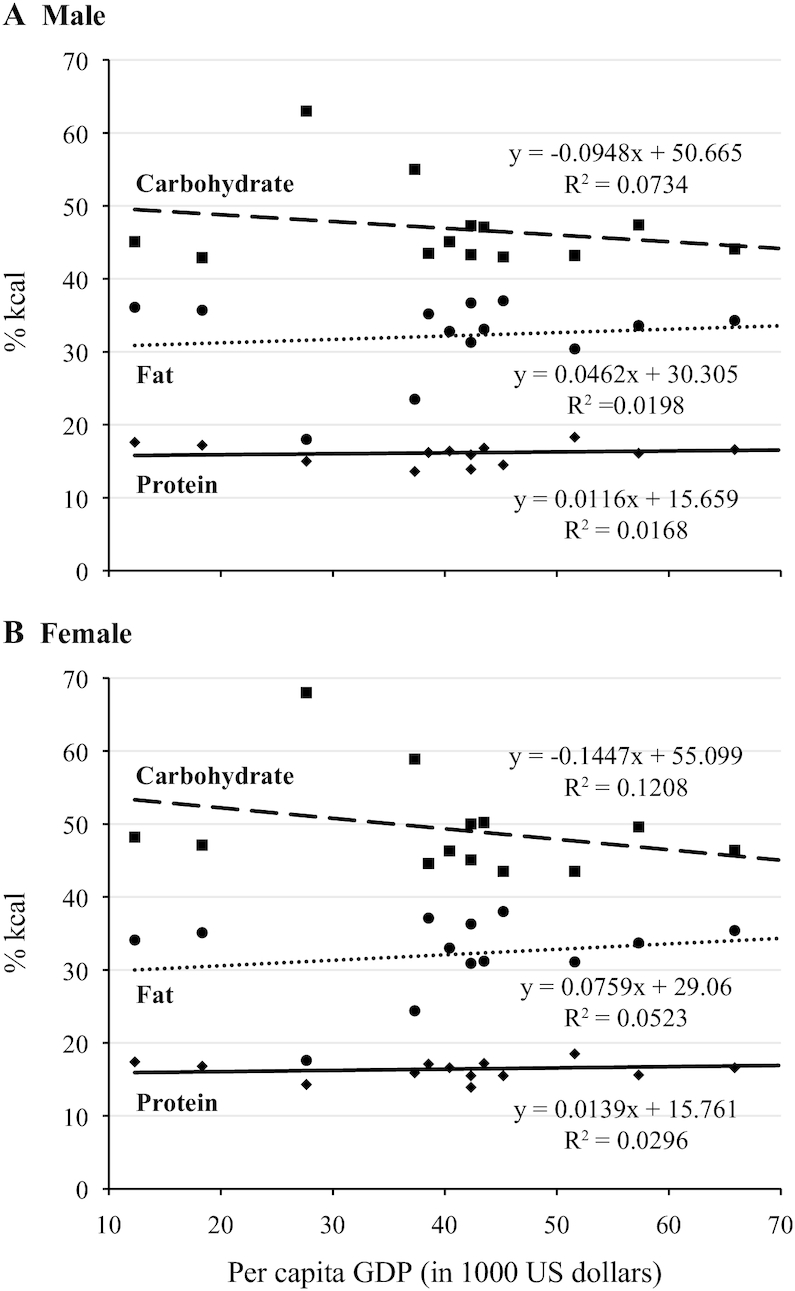
FIGURE 2.

Protein, carbohydrate, and fat intake (% kcal) in 14 populations by per capita gross domestic product. Data adapted from various national surveys (25, 27–39). Squares represent carbohydrate intake, circles represent fat intake, and diamonds represent protein intake. Panel A for males and panel B for females. GDP, gross domestic product.
