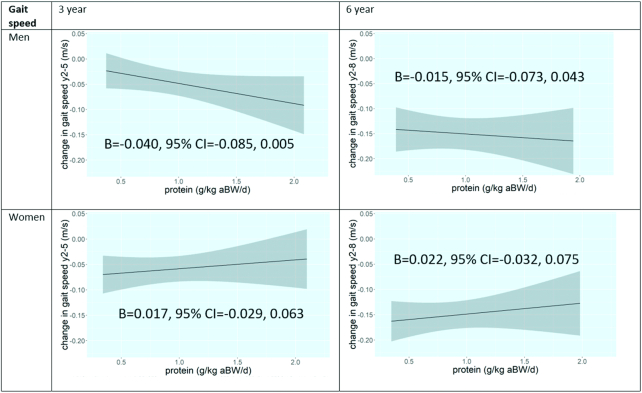
FIGURE 3.
Plots of associations of protein intake with 3- and 6-y change in gait speed in older participants of the Health, Aging, and Body Composition Study, according to sex. Model 3 is shown: adjusted for baseline gait speed, age, race, study site, educational level, walking, smoking, alcohol use, height, number of chronic diseases, oral steroid use, hospitalizations, eGFR, CES-D score, energy intake, and HEI score. aBW, adjusted body weight; B, unstandardized regression coefficient; CES-D, Center for Epidemiologic Studies Depression Scale; eGFR, estimated glomerular filtration rate; HEI, Healthy Eating Index; y2, study baseline; y5, 3-y follow-up examination; y8, 6-y follow-up examination.

