Figure 2.
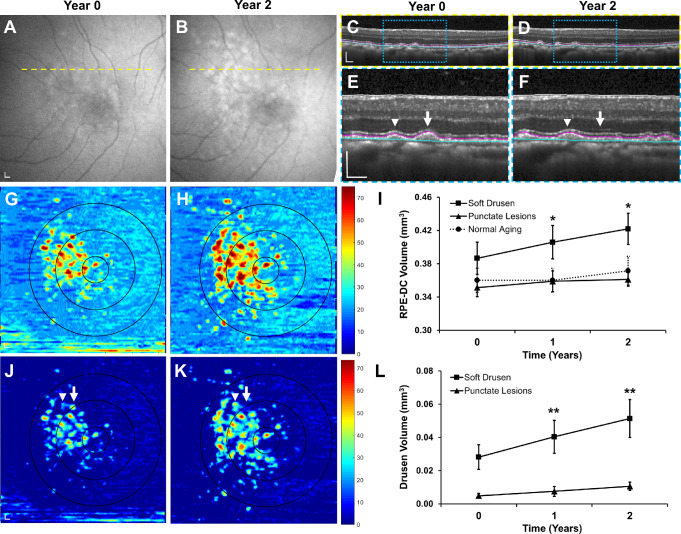
Progression of soft drusen volume in rhesus macaques over 2 years. Representative images of (A, B) fundus autofluorescence and (C, F) SD-OCT of an eye with soft drusen at years 0 and 2. SD-OCT scans in C and D correspond to the yellow dashed lines in A and B. Magnified views in E and F correspond to blue-dashed regions in C and D. Although most soft drusen increased in size (arrowheads) over 2 years, some lesions regressed or collapsed (arrow). Segmentation of the RPE (magenta line) and Bruch's membrane (cyan line) in C–F were used to generate (G, H) RPE-DC maps and measure (I) change in RPE-DC volume in the 5-mm-diameter circular region from years 0 to 2. The concentric circles in G and H represent the corresponding 1-mm-, 3-mm-, and 5-mm-diameter regions centered on the fovea at different time points. Abnormal thickening of the RPE-DC more than 2 standard deviations greater than mean age-matched normative data was used to generate (J, K) drusen maps and measure (L) change in drusen volume within the central 5-mm-diameter region. Data are presented as means ± SEM. N = 5 animals (10 eyes) per group. *P < 0.05. **P < 0.01. Scale bars: 200 μm.

