
Figure 2.
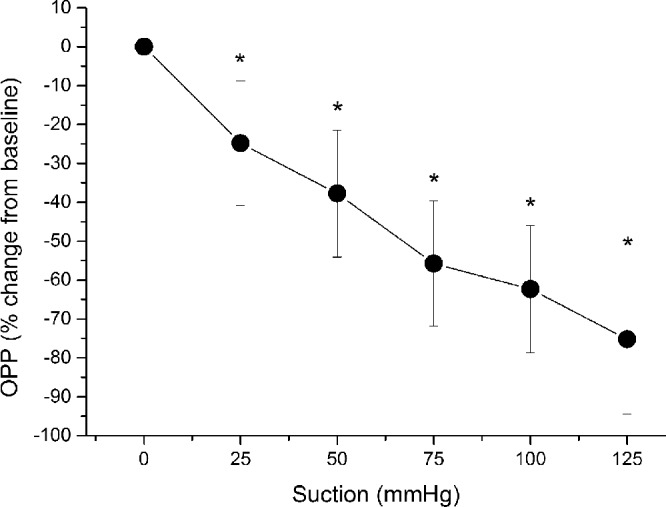
Relative change in OPP during application of the suction cup. Data are presented as mean ± SD (n = 15). *Significant changes versus baseline.
Official websites use .gov
A
.gov website belongs to an official
government organization in the United States.
Secure .gov websites use HTTPS
A lock (
) or https:// means you've safely
connected to the .gov website. Share sensitive
information only on official, secure websites.
Relative change in OPP during application of the suction cup. Data are presented as mean ± SD (n = 15). *Significant changes versus baseline.