
Figure 5.
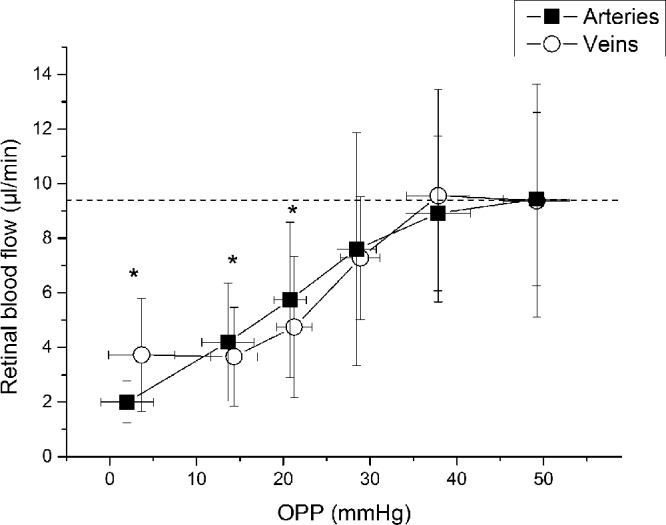
Pressure–flow relationship for retinal arteries and veins determined by categorized OPP and retinal blood flow during application of the suction cup. Data were sorted into groups of 15 values, each according to ascending OPP. Data are presented as mean ± SD (n = 15). *Significant changes versus baseline for retinal arteries and veins.