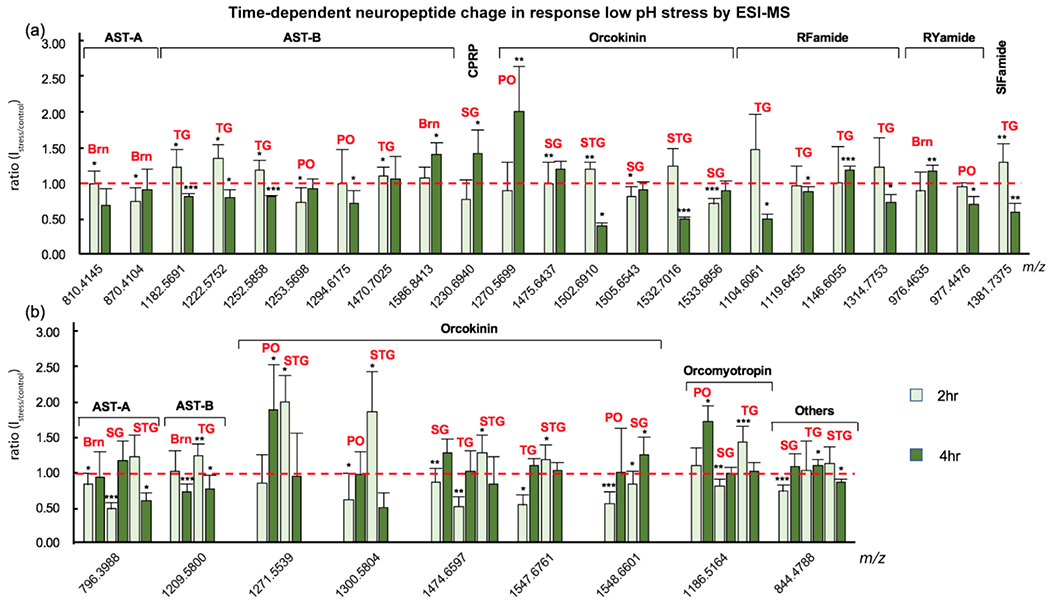
Figure 5.

Neuropeptide changes identified by ESI-MS at different time points in a single tissue (a) indicating the stress-related function of the peptide and in multiple tissues (b), indicating the hormonal role of the peptide when pH declined. X-axis, exact mass of neuropeptides (M+H+); Y-axis, peak intensity ratio of stress over control; Error bar, standard deviation; Red dash line indicated no change in peptide levels. Student’s t-test was applied to evaluate the significance of neuropeptide level changes upon stress compared to control groups. *p<0.05; **p<0.005; ***p<0.001. Brn, brain.
