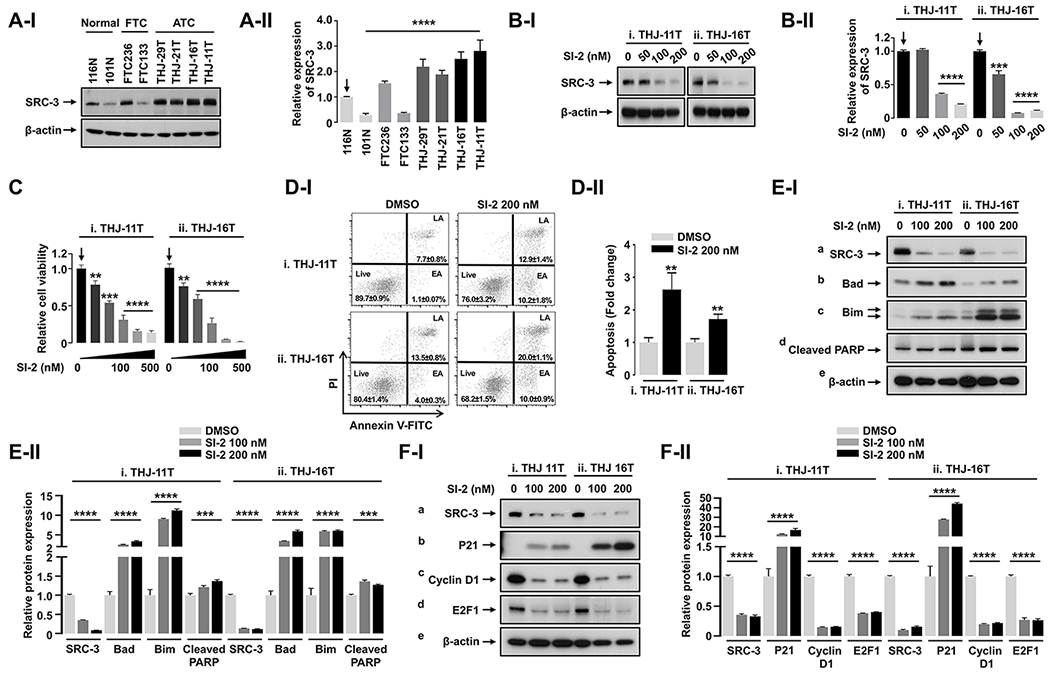
Figure 1. SI-2 Suppresses Proliferation through Induction of Apoptosis and Cell Cycle Arrest fin ATC Cells.

(A) Western blot (I) and its quantitative analysis (II, n = 3) showing different expression levels of SRC-3 protein in normal thyroid, FTC, and ATC cell lines. (B and C) Western blot (B-I) and its quantitative analysis (B-II, n = 3) showing dose-dependent inhibition of SRC-3 protein (B), and dose-dependent inhibition of cell proliferation (C, n = 3) by 48-hour treatment of SI-2 in ATC cells. (D) Annexin V apoptosis assay (I) and its quantitative analysis (II, n = 3) showing effect of SI-2 treatment on apoptosis in ATC cells. (E) Western blot (I) and its quantitative analysis (II, n = 3) showing effect of SI-2 treatment on protein expression of apoptosis-related molecules in ATC cells. (F) Western blot (I) and its quantitative analysis (II, n = 3) showing effect of SI-2 on protein expression of cell cycle-related molecules in ATC cells. Significant differences are indicated by asterisks (P < 0.01 [**], P < 0.001 [***], and P < 0.0001 [****]). Data represent the mean ± SD. Abbreviations: FTC, follicular thyroid cancer; ATC, anaplastic thyroid cancer.
