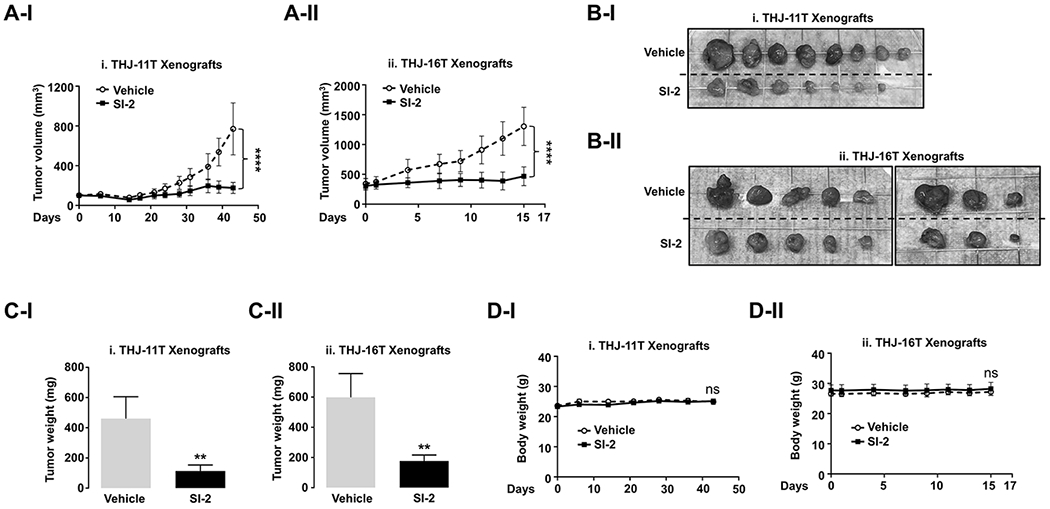
Figure 2. Therapeutic Efficacy of SI-2 in ATC Xenograft Mice Models.

(A-C) Growth curves (A), gross images (B), and weight (C) of THJ-11T (i) and -16T (ii) xenograft tumors treated with vehicle or SI-2. (D) Change in the body weight of the mice. Significant differences are indicated by asterisks (P < 0.05 [*] and P < 0.0001 [****]). Data represent the mean ± SD (For THJ-11T xenografts, vehicle group [n=8] and SI-2 group [n=7]; For THJ-16T xenografts, both groups [n =8]).
