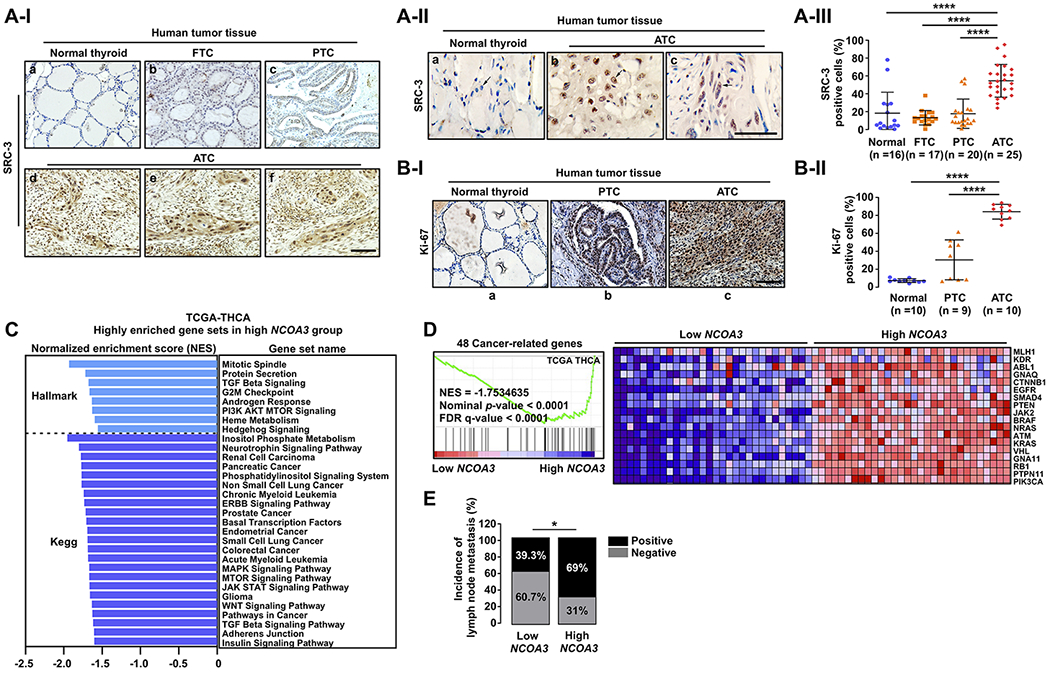
Figure 5. High Expression of SRC-3 Is Closely Related to Thyroid Cancer Aggressiveness in Human.

(A) Representative IHC images for SRC-3 (I), their magnified images (×2) showing nuclear staining of SRC-3 (II), and quantitative analysis for the IHC results (III) in different stages of human thyroid cancer. (B) Representative IHC images for Ki-67 (I) and quantitative analysis for the IHC results (II) in normal thyroid, PTC, and ATC. (C) Highly enriched Hallmark or Kegg gene sets related to multiple oncogenic pathways (nominal p-value < 0.05 and FDR q-value < 0.25) in high NCOA3 expression group, compared to low NCOA3 group. (D) Coordinated enrichment of 48 cancer-related genes in high NCOA3 expression group. (E) Comparison of incidence of cervical lymph node metastasis between the low and the high NCOA3 groups by two-tailed x2 test. (C-E) TCGA-THCA data analyses. For the GSEA and clinical data analyses, we used the transcriptome data of tumors with top 30 and bottom 30 NCOA3 expression levels in the TCGA-THCA data (low versus high NCOA3 group; n = 30, respectively). Significant differences were indicated by asterisks (P < 0.05 [*] and P < 0.0001 [****]). Scale bar represents 50 μm. Abbreviations: IHC, immunohistochemistry; FTC, follicular thyroid cancer; PTC, papillary thyroid cancer; ATC, anaplastic thyroid cancer; THCA. Thyroid cancer; GSEA, gene set enrichment analysis.
