
Fig. 3. Mean ± SD withdrawal behavioral scores by group over time for Experiment 1.
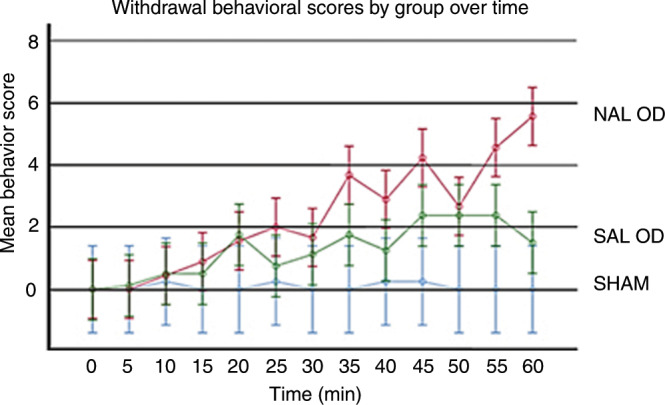
Analysis by two-way ANOVA for the model: F = 7.95, p < 0.001, by group: F = 47.05, p < 0.001, by time: F = 6.51, p < 0.001, and by group–time: F = 2.98, p < 0.001.
Official websites use .gov
A
.gov website belongs to an official
government organization in the United States.
Secure .gov websites use HTTPS
A lock (
) or https:// means you've safely
connected to the .gov website. Share sensitive
information only on official, secure websites.
Analysis by two-way ANOVA for the model: F = 7.95, p < 0.001, by group: F = 47.05, p < 0.001, by time: F = 6.51, p < 0.001, and by group–time: F = 2.98, p < 0.001.