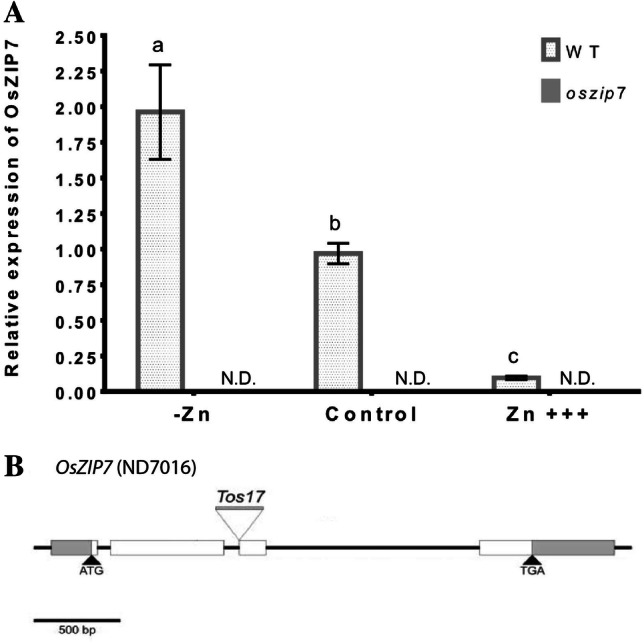
Fig. 1.

OsZIP7 gene expression under varying Zn concentrations and characterization of oszip7 line. A OsZIP7 expression under Zn deficiency (no Zn added), control conditions and Zn excess (200 µM). Different letters indicate statistically significant differences between means compared to control. Data is shown as mean ± SEM. B Gene model of OsZIP7 and insertion site of Tos17 in our mutant line. c OsZIP7 expression in the oszip7 mutant line
