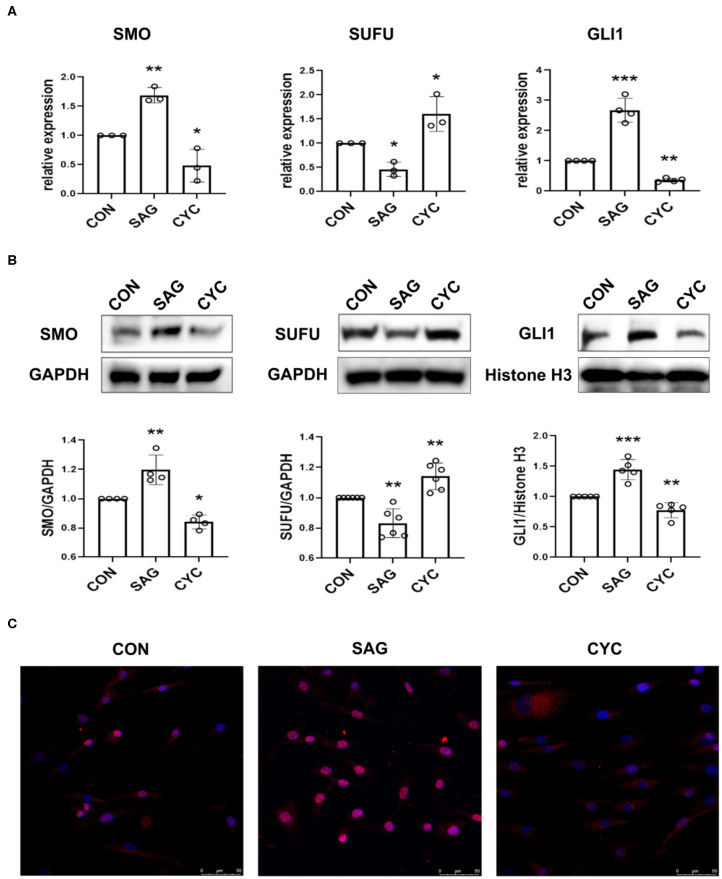
Figure 1.
SAG and cyclopamine modulate the activation of SHH signaling. (A) SMO, SUFU and GLI1 mRNA expression was evaluated by real-time PCR after FLSs were treated with SAG (1 μM) or cyclopamine (10 μM) for 24 h. Relative quantification of gene expression was performed by the 2−ΔΔCt method. (B) The expression of SMO, SUFU and GLI1 was measured by Western Blot after FLSs were treated with SAG (1 μM) or cyclopamine (10 μM) for 48 h. Total protein was isolated for detection of SMO and SUFU and nuclear extracts were prepared for detection of GLI1. Results were normalized to loading control (GAPDH for total protein and Histone H3 for nuclear extracts). The results are shown as the mean ± S.D. (C) The distribution of GLI1 protein was measured by immunofluorescence (n = 3). FLSs were treated with SAG or cyclopamine for 48 h and stained with anti-GLI1 antibody (red signal) and DAPI (blue signal). Representative images are shown at 200 × magnification. FLSs in control group were treated with vehicle (DMSO supplemented in DMEM with 10% FBS). Data were analyzed using one-way analysis of variance (ANOVA). post hoc comparisons were made by Dunnett's test (A,B). *P < 0.05 vs. control group. **P < 0.01 vs. control group. ***P < 0.001 vs. control group. CON, control group; CYC, cyclopamine; SP, SP600125.

