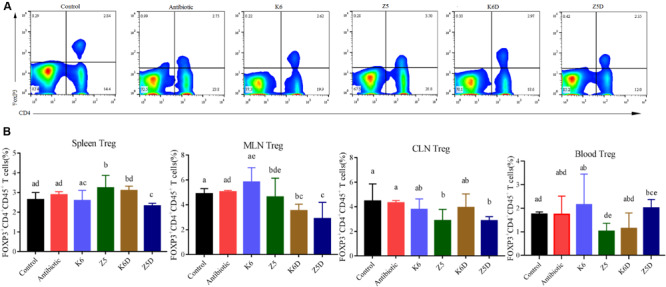
FIGURE 6.

Treg inhibition and its role in DSS-induced colitis in mice. (A,B) Flow plots and quantification of Tregs in the spleen and in the spleens, MLNs, CLNs, and blood in each group. Different letters indicate significant differences (P < 0.05, one-way ANOVA) between different groups (mean ± SD, n = 3–7 mice per group).
